gProfiler combines multiple sampling profilers to produce unified visualization of what your CPU is spending time on, displaying stack traces of all processes running on your system across native programs1 (includes Golang), Java and Python runtimes, and kernel routines.
gProfiler can upload its results to the Granulate Performance Studio or to a self hosted studio, which aggregates the results from different instances over different periods of time and can give you a holistic view of what is happening on your entire cluster. To upload results, you will have to register and generate a token on the website.
gProfiler runs on Linux (on x86_64 and Aarch64; Aarch64 support is not complete yet and not all runtime profilers are supported, see architecture support).
For installation methods, jump to run as...

This section describes the possible options to control gProfiler's behavior.
gProfiler can produce output in two ways:
-
Create an aggregated, collapsed stack samples file (
profile_<timestamp>.col) and a flamegraph file (profile_<timestamp>.html). Two symbolic links (last_profile.colandlast_flamegraph.html) always point to the last output files.Use the
--output-dir/-ooption to specify the output directory.If
--rotating-outputis given, only the last results are kept (available vialast_profle.colandlast_flamegraph.html). This can be used to avoid increasing gProfiler's disk usage over time. Useful in conjunction with--upload-results(explained ahead) - historical results are available in the Granulate Performance Studio, and the very latest results are available locally.--no-flamegraphcan be given to avoid generation of theprofile_<timestamp>.htmlfile - only the collapsed stack samples file will be created.The output is a collapsed file (
.col) and its format is described ahead. -
Send the results to the Granulate Performance Studio for viewing online with filtering, insights, and more.
Use the
--upload-results/-uflag. Pass the--tokenoption to specify the token provided by Granulate Performance Studio, and the--service-nameoption to specify an identifier for the collected profiles, as will be viewed in the Granulate Performance Studio. Profiles sent from numerous gProfilers using the same service name will be aggregated together.
Note: both flags can be used simultaneously, in which case gProfiler will create the local files and upload the results.
When --upload-results is used, gProfiler will communicate with https://profiler.granulate.io and https://api.granulate.io. Make sure those domains are accessible for HTTPS access. Additionally, if you download gProfiler from the GitHub releases you'll need https://github.com, or if you use the Docker image you'll need the Docker registry accessible (https://index.docker.io by default).
If you require an HTTPS proxy, make sure the proxy has those domains whitelisted.
--profiling-frequency: The sampling frequency of the profiling, in hertz.--profiling-duration: The duration of the each profiling session, in seconds.
The default profiling frequency is 11 hertz. Using higher frequency will lead to more accurate results, but will create greater overhead on the profiled system & programs.
For each profiling session (each profiling duration), gProfiler produces outputs (writing local files and/or uploading the results to the Granulate Performance Studio).
--no-javaor--java-mode disabled: Disable profilers for Java.--no-java-async-profiler-buildids: Disable embedding of buildid+offset in async-profiler native frames (used when debug symbols are unavailable).
--no-python: Alias of--python-mode disabled.--python-mode: Controls which profiler is used for Python.auto- (default) try with PyPerf (eBPF), fall back to py-spy.pyperf- Use PyPerf with no py-spy fallback.pyspy/py-spy- Use py-spy.disabled- Disable profilers for Python.
Profiling using eBPF incurs lower overhead & provides kernel & native stacks.
--php-mode phpspy: Enable PHP profiling with phpspy.--no-phpor--php-mode disabled: Disable profilers for PHP.--php-proc-filter: Process filter (pgrep) to select PHP processes for profiling (this is phpspy's-Poption)
--dotnet-mode=dotnet-trace: Enable .NET profiling with dotnet-trace--no-dotnetor--dotnet-mode=disabled: Disable profilers for .NET.
--no-rubyor--ruby-mode disabled: Disable profilers for Ruby.
--nodejs-mode: Controls which profiler is used for NodeJS.none- (default) no profiler is used.perf- augment the system profiler (perf) results with jitdump files generated by NodeJS. This requires running yournodeprocesses with--perf-prof(and for Node >= 10, with--interpreted-frames-native-stack). See this NodeJS page for more information.attach-maps- Generates perf map in runtime, see description ahead.
In this mode, gProfiler will automatically load a library based on node-linux-perf module to all target NodeJS processes. This library enables perf-pid.map files generation in runtime, without requiring the app to be started with the --perf-prof flag, and from that point perf is able to symbolicate the compiled JavaScript functions, and we get JavaScript symbols properly.
gProfiler uses the inspector protocol (documented here) to connect to target processes. gProfiler will send SIGUSR1, connect to the process and request to it load the library matching its NodeJS version (gProfiler comes built-in with arsenal of libraries for common NodeJS versions). After the library is loaded, gProfiler invokes the perf-pid.map generation. This is done to all running NodeJS processes - those running before gProfiler started, and done starting during gProfiler's run. Upon stopping, gProfiler stops the functionality, so processes no longer continue to write those file.
This requires the entrypoint of application to be CommonJS script. (Doesn't work for ES modules)
Golang profiling is based on perf, used via the system profiler (explained in System profiling options).
As with all native programs, the Golang program must have symbols - not stripped - otherwise, additional debug info files must be provided. Without symbols info (specifically the .symtab section) perf is unable to symbolicate the stacktraces of the program. In that case gProfiler will not tag the stacks as Golang and you will not see any symbols.
Make sure you are not passing -s to the -ldflags during your build - -s omits the symbols table; see more details here.
--perf-mode: Controls the global perf strategy. Must be one of the following options:fp- Use Frame Pointers for the call graph. This is the default.dwarf- Use DWARF for the call graph (adds the--call-graph dwarfargument to theperfcommand)smart- Run bothfpanddwarf, then choose the result with the highest average of stack frames count, per process.disabled- Avoids runningperfat all. See perf-less mode.
gProfiler uses the Python requests package, which works with standard HTTP proxies environment, e.g https_proxy or HTTPS_PROXY (note - https and not http).
If running gProfiler as an executable and using sudo, make sure to run sudo -E if you have the environment variable defined (otherwise, sudo will forget it). Alternatively, you can run sudo https_proxy=my-proxy /path/to/gprofiler ....
If running gProfiler as a Docker container, make sure to add -e https_proxy=my-proxy to the docker run command line (the spawned container does not inherit your set of environment variables, you have to pass it manually).
If you still get connection errors, make sure the proxy is indeed used by the profiler - in the Failed to connect to server error message you'll see the proxy used by the profiler (under Proxy used:).
By default, gProfiler sends logs to Granulate Performance Studio (when using --upload-results/-u flag)
This behavior can be disabled by passing --dont-send-logs or the setting environment variable GPROFILER_DONT_SEND_LOGS=1.
By default, gProfiler agent sends system metrics (CPU and RAM usage) and metadata to the Performance Studio.
The metadata includes system metadata like the kernel version and CPU count, and cloud metadata like the type of the instance you are running on.
The metrics collection will not be enabled if the --upload-results/-u flag is not set.
Otherwise, you can disable metrics and metadata by using the following parameters:
- Use
--disable-metrics-collectionto disable metrics collection - Use
--disable-metadata-collectionto disable metadata collection
gProfiler can be run in a continuous mode, profiling periodically, using the --continuous/-c flag.
Note that when using --continuous with --output-dir, a new file will be created during each sampling interval.
Aggregations are only available when uploading to the Granulate Performance Studio.
gProfiler can be used to upload external .col file to Granulate Performance Studio by using upload-file subcommand.
In case of gProfiler run volume mapping flag must be added. Example for docker usage: docker run --name granulate-gprofiler -v <path-to-.col>:<path-to-.col> --pid=host --userns=host --privileged gprofiler:latest upload-file --token=<token> --service-name="<service>" --file-path <path-to-.col>
It is also possible to add custom start and end time (in the form of UTC ISO 8601 format time in Python timestamps) to the metadata, so that it will be properly categorized in the Granulate Performance Studio (i.e. # {"start_time": "2022-10-21T13:51:29.640637","end_time": "2022-10-21T13:54:29.640637", ...)
This section lists the various execution modes for gProfiler (as a container, as an executable, etc...).
Run the following to have gProfiler running continuously, uploading to Granulate Performance Studio:
docker pull granulate/gprofiler:latest
docker run --name granulate-gprofiler -d --restart=on-failure:10 \
    --pid=host --userns=host --privileged \
granulate/gprofiler:latest -cu --token="<TOKEN>" --service-name="<SERVICE NAME>" [options]First, check if gProfiler is already running - run pgrep gprofiler. You should not see any output, if you do see any PIDs it means that gProfiler is running and it must be stopped before starting it again (you can stop it with sudo pkill -TERM gprofiler).
Run the following to have gprofiler running continuously, in the background, uploading to Granulate Performance Studio:
wget https://github.com/Granulate/gprofiler/releases/latest/download/gprofiler_$(uname -m) -O gprofiler
sudo chmod +x gprofiler
sudo TMPDIR=/proc/self/cwd sh -c "setsid ./gprofiler -cu --token=\"<TOKEN>\" --service-name=\"<SERVICE NAME>\" [options] > /dev/null 2>&1 &"
sleep 1
pgrep gprofiler # make sure gprofiler has started
If the pgrep doesn't find any process, try running without > /dev/null 2>&1 & so you can inspect the output, and look for errors.
For non-daemon mode runes, you can remove the setsid and > /dev/null 2>&1 & parts.
The logs can then be viewed in their default location (/var/log/gprofiler).
TMPDIR is added because gProfiler unpacks executables to /tmp by default; this is done by staticx. For cases where /tmp is marked with noexec, we add TMPDIR=/proc/self/cwd to have everything unpacked in your current working directory, which is surely executable before gProfiler was started in it.
You can generate a systemd service configuration that runs gProfiler as an executable by running:
curl -s https://raw.githubusercontent.com/Granulate/gprofiler/master/deploy/systemd/create_systemd_service.sh | GPROFILER_TOKEN=<TOKEN> GPROFILER_SERVICE=<SERVICE_NAME> bashThis script generates granulate-gprofiler.service in your working directory, and you can go ahead and install it by:
systemctl enable $(pwd)/granulate-gprofiler.service
systemctl start granulate-gprofiler.service
For Databricks, the same installation instructions as specified in the running as an executable section can be used (make sure to run them in the initialization script of your node).
Additionally, 2 more flags need to be added to gProfiler's commandline: --disable-pidns-check --perf-mode=none. You can add them right after the --service-name argument.
--disable-pidns-checkis required because gProfiler won't run in the init PID NS.--perf-mode=noneis required because gProfiler will not have permissions to run system-wideperf, so we will profile only runtime processes, such as Java. See perf-less mode for more information.
By using --databricks-job-name-as-service-name, gProfiler will use the Job Clusters' Job Name as service name.
In case gProfiler successfully managed to extract the Job Name, the service name will be databricks-job-<JOB_NAME>.
By default, this functionality relies on spark.databricks.clusterUsageTags.clusterAllTags property
to extract the Job Name.
In case gProfiler spots this property is redacted, gProfiler will use the
spark.databricks.clusterUsageTags.clusterName property as service name.
See gprofiler.yaml for a basic template of a DaemonSet running gProfiler.
Make sure to insert the GPROFILER_TOKEN and GPROFILER_SERVICE variables in the appropriate location!
Like with the DaemonSet, make sure to insert the GPROFILER_TOKEN and GPROFILER_SERVICE variables in the appropriate location.
cd deploy/k8s/helm-charts
helm install --set gprofiler.token="GPROFILER_TOKEN" --set gprofiler.serviceName="GPROFILER_SERVICE" gprofiler .

# To view additional configuration options you can run:
helm show values .
If your OpenShift cluster uses SCCs, the gProfiler Pods might get an error FailedCreate with the reason unable to validate against any security context constraint.
If this happens, we must grant the privileged SCC to the gProfiler DaemonSet to have the Pods scheduled.
This is done by creating a Role that's allowed to use the privileged SCC, then granting that Role via a RoleBinding to a ServiceAccount that is used in gProfiler's DaemonSet. The 3 objects (ServiceAccount, Role, RoleBinding) can be found in scc.yaml. After applying that file, all you need to do is add serviceAccountName: granulate-service-account to the gProfiler Pod spec, re-apply the DaemonSet and verify that created Pods have the openshift.io/scc: privileged annotation, which means they have successfully used the SCC.
- Go to ECS, and create a new task definition
- Choose EC2, and click
Next Step - Scroll to the bottom of the page, and click
Configure via JSON

- Replace the JSON contents with the contents of the gprofiler_task_definition.json file and Make sure you change the following values:
- Replace
<TOKEN>in the command line with your token you got from the gProfiler Performance Studio site. - Replace
<SERVICE NAME>in the command line with the service name you wish to use.
- Replace
- Note - if you wish to see the logs from the gProfiler service, be sure to follow AWS's guide on how to auto-configure logging, or to set it up manually yourself.
- Click
Save - Click
Create
- Go to your ECS Clusters and enter the relevant cluster
- Click on
Services, and chooseCreate - Choose the
EC2launch type and thegranulate-gprofilertask definition with the latest revision - Enter a service name
- Choose the
DAEMONservice type - Click
Next stepuntil you reach theReviewpage, and then clickCreate Service
At the time of this writing, Fargate does not support DAEMON tasks (see this tracking issue).
Since Fargate containers don't run with the full set of Linux capabilities, some of the profilers are not supported at all, and others require modifying the Fargate container definition to add the SYS_PTRACE capability, which is not included by default.
| Runtime | Supported |
|---|---|
| perf (native, Golang, ...) | No |
| Java (async-profiler) | Yes |
| Python (py-spy) | Yes (with SYS_PTRACE) |
| Python (PyPerf eBPF) | No |
| Ruby (rbspy) | Yes (with SYS_PTRACE) |
| PHP (phpspy) | Yes (with SYS_PTRACE) |
| NodeJS (perf) | No |
| .NET (dotnet-trace) | Yes |
Furthermore, Fargate does not allow using "pidMode": "host" in the task definition (see documentation of pidMode here). Host PID is required for gProfiler to be able to profile processes running in other containers (in case of Fargate, other containers under the same containerDefinition).
So in order to deploy gProfiler, we need to modify a container definition to include running gProfiler alongside the actual application. This can be done with the following steps:
-
Modify the
command&entryPointparameters of your entry in thecontainerDefinitionsarray. The new command should include downloading of gProfiler & executing it in the background, andentryPointwill be["/bin/bash"].For example, if your default
commandis["python", "/path/to/my/app.py"], we will now change it to:["-c", "(wget https://github.com/Granulate/gprofiler/releases/latest/download/gprofiler -O /tmp/gprofiler; chmod +x /tmp/gprofiler; /tmp/gprofiler -cu --token=<TOKEN> --service-name=<SERVICE NAME>) & python /path/to/my/app.py"].Make sure to:
- Replace
<TOKEN>in the command line with your token you got from the gProfiler Performance Studio site. - Replace
<SERVICE NAME>in the command line with the service name you wish to use.
This new command will start the downloading of gProfiler in the background, then run your application. Make sure to JSON-escape any characters in your command line! For example,
"are replaced with\".Additionally, we will set
entryPointto["/bin/bash"]. If you had usedentryPointprior to incorporating gProfiler, make sure to use it in the newcommand.gProfiler will assume
--disable-pidns-checkand--perf-mode nonewere given. These flags are explained in running-on-databricks.gProfiler and its installation process will send the outputs to your container's stdout & stderr. After verifying that everything works, you can append
> /dev/null 2>&1to the gProfiler command parenthesis (in this example, before the& python ...) to prevent it from spamming your container logs.This requires your image to have
wgetinstalled - you can make surewgetis installed, or substitute thewgetcommand withcurl -SL https://github.com/Granulate/gprofiler/releases/latest/download/gprofiler --output /tmp/gprofiler, or any other HTTP-downloader you wish. - Replace
-
This step is required if you wish to profile a runtime environment that requires
SYS_PTRACEper the table mentioned above, in the beginning of the Fargate section. If you need to addSYS_PTRACEfor your runtime environment - currently that's for Python, Ruby and PHP - addlinuxParametersto the container definition (this goes directly in your entry incontainerDefinitinos):"linuxParameters": { "capabilities": { "add": [ "SYS_PTRACE" ], }, },
Alternatively, you can download gProfiler in your Dockerfile to avoid having to download it every time in run-time. Then you just need to invoke it upon container start-up.
You can run a gProfiler container with docker-compose by using the template file in docker-compose.yml.
Start by replacing the <TOKEN> and <SERVICE NAME> with values in the command section -
<TOKEN>should be replaced with your personal token from the gProfiler Performance Studio site (in the Install Service section)- The
<SERVICE NAME>should be replaced with whatever service name you wish to use
Optionally, you can add more command line arguments to the command section. For example, if you wish to use the py-spy profiler, you can add --python-mode pyspy to the commandline.
To run it, run the following command:
docker-compose -f /path/to/docker-compose.yml up -dTo run gProfiler on your cluster, you will need to add an initialization action that will install the agent on all of your workers when the cluster is created.
First, upload the gProfiler initialization action script file to your Google Cloud Storage bucket -
gsutil cp gprofiler_initialization_action.sh gs://<YOUR BUCKET>If you don't have a Google Storage bucket, make sure you create one (documentation).
Then, create your Dataproc cluster with the --initialization-actions flag -
export TOKEN='<TOKEN>' && \
export SERVICE='<SERVICE NAME>' && \
gcloud dataproc clusters create <CLUSTER NAME> \
--initialization-actions gs://<YOUR BUCKET>/gprofiler_initialization_action.sh \
--metadata gprofiler-token="$TOKEN",gprofiler-service="$SERVICE",enable-stdout="1" --region <REGION>
Note - make sure to replace the placeholders with the appropriate values -
- Replace
<TOKEN>in the command line with your token you got from the gProfiler Performance Studio site. - Replace
<SERVICE NAME>in the command line with the service name you wish to use. - Replace
<YOUR BUCKET>with the bucket name you have uploaded the gProfiler initialization action script to. - Replace
<CLUSTER NAME>with the cluster name you wish to use - Replace
<REGION>with the region you wish to use
If you are experiencing issues with your gProfiler installation (such as no flamegraphs available in the Performance Studio
after waiting for more than 1 hour) you can look at gProfiler's logs and see if there are any errors.
To see gProfiler's logs, you must enable its output by providing enable-stdout="1" in the cluster metadata when creating the Dataproc cluster. You can use the example above.
Wait at least 10 minutes after creating your cluster, and then you can SSH into one of your cluster instances via either Dataproc's web interface or the command line.
After connecting to your instance, run the following command:
tail -f /var/log/dataproc-initialization-script-0.logIf you have more than one initialization script, try running the command with an increasing number instead of 0 in the command find the appropriate gProfiler log file.
By default, gProfiler's output is written to the Dataproc initialization script output file (/var/log/dataproc-initialization-script-{Incrementing number}.log).
If you wish to disable this behaviour, change the enable-stdout metadata variable value to "0" (the default is "1").
To run gProfiler on your AWS EMR cluster, add a bootstrap action that will launch gProfiler on each node when the cluster is provisioned. You will need to provide the token and service name as described below.
-
Upload the gProfiler bootstrap action file to an S3 bucket:
aws s3 cp gprofiler_action.sh s3://<BUCKET>/gprofiler_action.sh
-
Add the bootstrap action when creating the cluster. You can do this with the AWS Console or with the AWS CLI:
In the steps below, make sure to:
- Replace
<BUCKET>with the bucket wheregprofiler_action.shwas uploaded. - Replace
<TOKEN>with the token you got from the gProfiler Performance Studio site. - Replace
<SERVICE>with the service name you wish to use.
With AWS CLI:
aws emr create-cluster --name "My cluster" ... --bootstrap-actions Path="s3://<BUCKET>/gprofiler_action.sh",Args="[--token=<TOKEN>,--service-name=<SERVICE>]"
With new AWS Console:
- Create a new cluster.
- Under Bootstrap actions, choose Add, and fill in the fields:
- Name: gProfiler
- Script location:
s3://<BUCKET>/gprofiler_action.sh - Arguments:
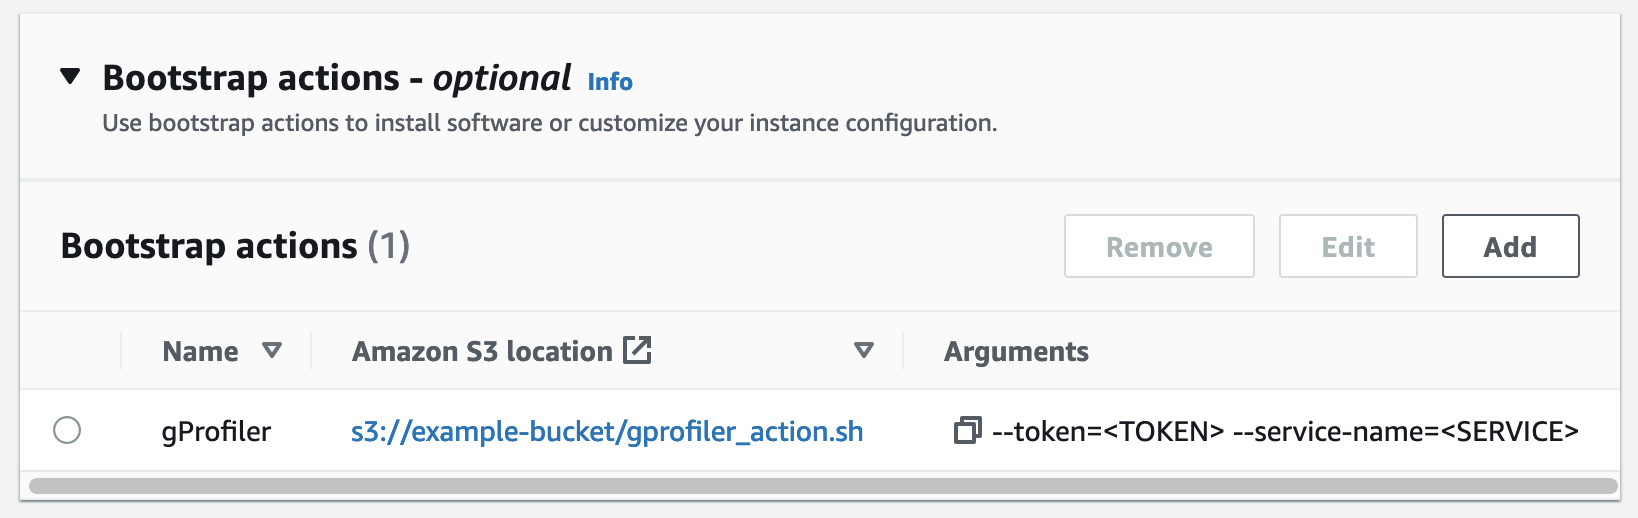
--token=<TOKEN> --service-name=<SERVICE> - Example:
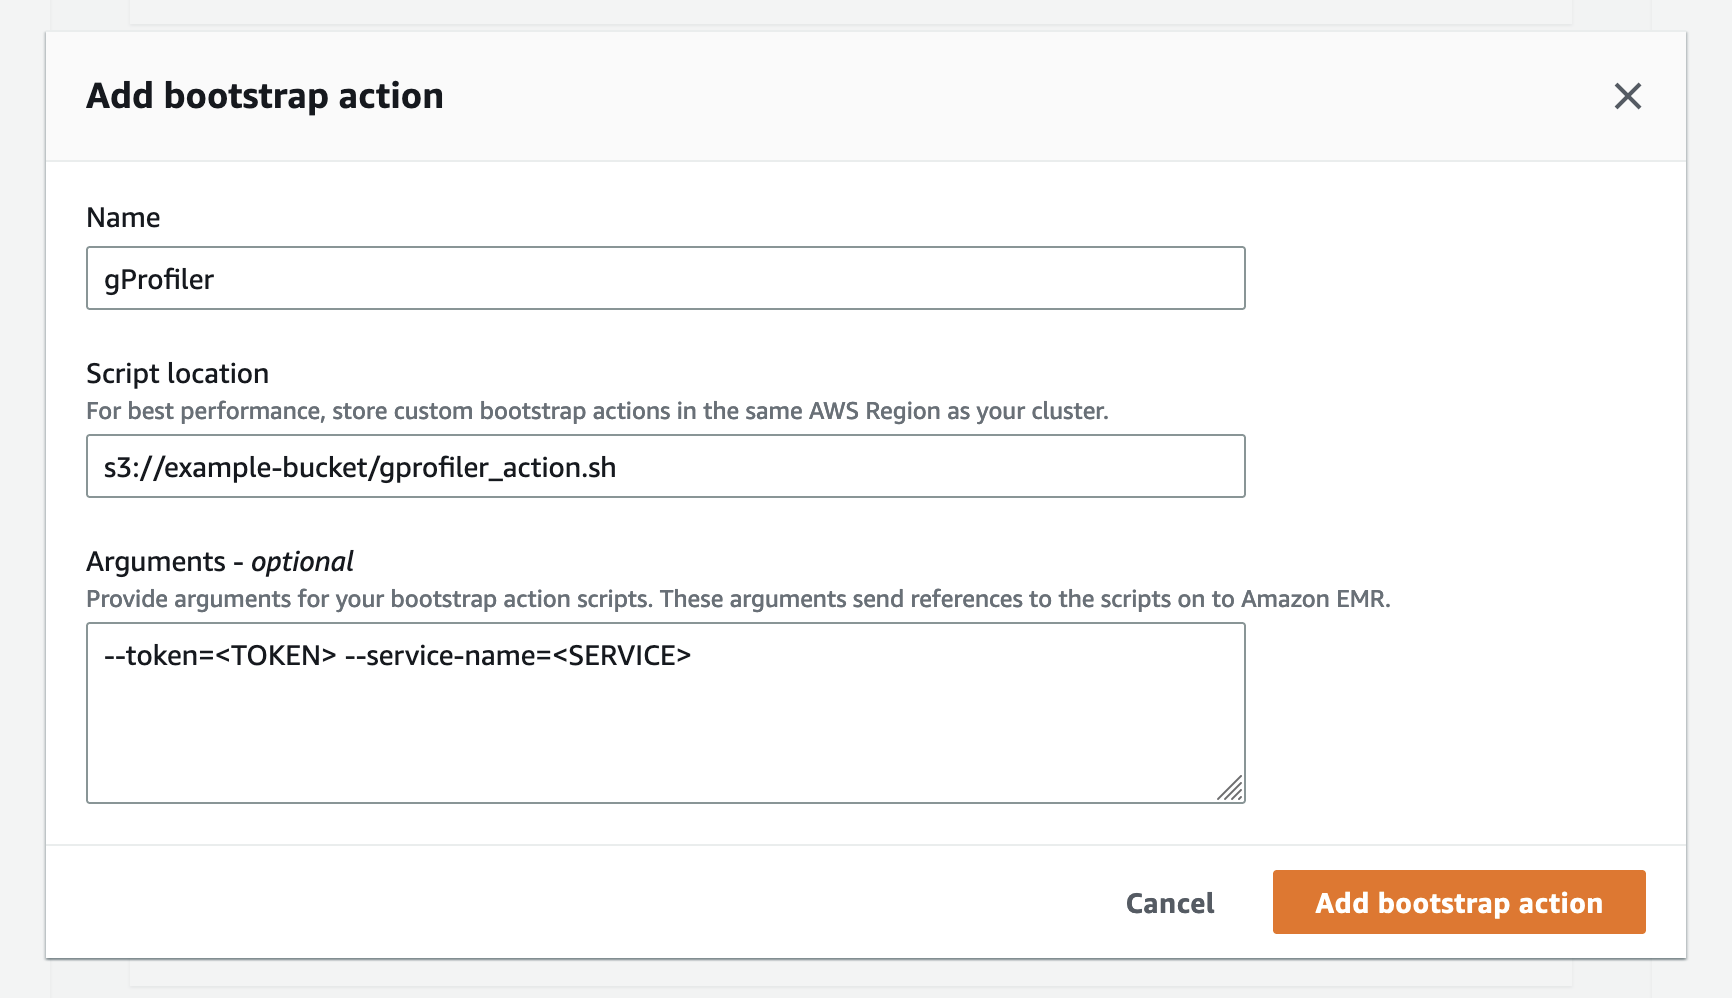
- Final result should look similar to this:
- Replace


Download the playbook and run it this way:
ansible-playbook -i ... gprofiler_playbook.yml --extra-vars "gprofiler_token='<TOKEN>'" --extra-vars "gprofiler_service='<SERVICE NAME>'"
Note - the playbook defaults to hosts: all, make sure to modify the pattern to your liking before running.
The playbook defines 2 more variables:
gprofiler_path- path to download gProfiler to,/tmp/gprofilerby default.gprofiler_args- additional arguments to pass to gProfiler, empty by default. You can use it to pass, for example,'--profiling-frequency 15'to change the frequency.
gProfiler requires Python 3.8+ to run.
pip3 install -r requirements.txt
./scripts/copy_resources_from_image.sh
Then, run the following as root:
python3 -m gprofiler [options]gProfiler invokes perf in system wide mode, collecting profiling data for all running processes.
Alongside perf, gProfiler invokes runtime-specific profilers for processes based on these environments:
- Java runtimes (version 7+) based on the HotSpot JVM, including the Oracle JDK and other builds of OpenJDK like AdoptOpenJDK and Azul Zulu.
- Uses async-profiler.
- The CPython interpreter, versions 2.7 and 3.5-3.10.
- eBPF profiling (based on PyPerf) requires Linux 4.14 or higher; see Python profiling options for more info.
- If eBPF is not available for whatever reason, py-spy is used.
- PHP (Zend Engine), versions 7.0-8.0.
- Uses Granulate's fork of the phpspy project.
- Ruby versions (versions 1.9.1 to 3.0.1)
- Uses Granulate's fork of the rbspy profiler.
- NodeJS (version >= 10 for functioning
--perf-prof):- Uses
perf inject --jitand NodeJS's ability to generate jitdump files. See NodeJS profiling options. - Can also generate perf maps at runtime - see attach-maps option.
- Uses
- .NET runtime
- Uses dotnet-trace.
The runtime-specific profilers produce stack traces that include runtime information (i.e, stacks of Java/Python functions), unlike perf which produces native stacks of the JVM / CPython interpreter.
The runtime stacks are then merged into the data collected by perf, substituting the native stacks perf has collected for those processes.
| Runtime | x86_64 | Aarch64 |
|---|---|---|
| perf (native, Golang, ...) | ✔️ | ✔️ |
| Java (async-profiler) | ✔️ | ✔️ |
| Python (py-spy) | ✔️ | ✔️ |
| Python (PyPerf eBPF) | ✔️ | ❌ |
| Ruby (rbspy) | ✔️ | ✔️ |
| PHP (phpspy) | ✔️ | ✔️ (experimental) |
| NodeJS (perf) | ✔️ | ✔️ |
| .NET (dotnet-trace) | ✔️ (experimental) | ✔️ (experimental) |
It is possible to run gProfiler without using perf - this is useful where perf can't be used, for whatever reason (e.g permissions). This mode is enabled by --perf-mode disabled.
In this mode, gProfiler uses runtime-specific profilers only, and their results are concatenated (instead of scaled into the results collected by perf). This means that, although the results from different profilers are viewed on the same graph, they are not necessarily of the same scale: so you can compare the samples count of Java to Java, but not Java to Python.
This section describes the data format output by the profiler. Some of it is relevant to the local output files (.col) files and some of it is relevant both for the local output files and for the data as viewable in the Performance Studio.
The collapsed file (.col) is a collapsed/folded stacks file that'll be written locally per profiling session if gProfiler was invoked with the -o switch.
The file begins with a "comment line", starting with #, which contains a JSON of metadata about the profile. Following lines are stacks - they consist of frames separated by ;, with the ending of each line being a space followed by a number - how many samples were collected with this stack.
The first frame of each stack is an index in the application metadata array (which is part of the aforementioned JSON), for the process recorded in this sample.
The second frame is the container name that the process recorded in this sample runs in; if the process is not running in a container, this frame will be empty.
The third frame is the process name - essentially the process comm in Linux.
All following frames are the output of the profiler which emitted the sample (usually - function names). Frames are described in frame format.
An application identifier ("appid" for short) is an optional frame that follows the process name frame. This frame has the format appid: .... Per profiled process, gProfiler attempts to extract its appid, and "inject" it into the profile collected for that process - the purpose is to give the user more context about the source application of the proceeding frames.
For example, a Python application invoked as cd /path/to/my/app && python myscript.py will have the following appid: appid: python: myscript.py (/path/to/my/app/myscript.py) - this appid tells us it's a Python application running myscript.py and gives in parenthesis the absolute path of the executed script.
gProfiler currently supports appids for Java, Python, NodeJS & Ruby, with each runtime having possibly more than one implementation (e.g in Python, the appid of a Gunicorn-based application is decided differently, because the app doesn't specify a "Python script" to invoke, but instead specifies a WSGI application spec). You can see the various implementations in application_identifiers.py
Collection of appids is enabled by default and can be disabled with the --disable-application-identifiers switch.
Each frame represents a function as identified by gProfiler. Since gProfiler aggregated frames collected by different profilers, the frame format differs depending on which profiler collected it, and from which runtime it originates (e.g Python vs Java). Additionally, each frame has a suffix which designates the profiler it originated from and the logical "source" for the frame - is it Java code? Kernel code? Native library code?
| Runtime | Frame Format | Suffix |
|---|---|---|
| Native - C, C++, Rust (perf) | Symbol name | None |
| Golang (perf) | Symbol name | None |
| Java (async-profiler) | Method FQN + signature, per async-profiler's -g switch. ;s in the method signature are replaced with | |
Per asnyc-profiler -a switch |
| Native (async-profiler) | Symbol name | None |
| Python (PyPerf) | package.(instance class if it's a method/classmethod).function_name (filename.py:line_number) |
_[p] |
| Native (PyPerf) | Symbol name | _[pn] |
| Python (py-spy) | package.function_name (filename.py:line_number) |
_[p] |
| NodeJS (perf) | Per NodeJS | None |
| Ruby (rbspy) | Per rbspy | _[rb] |
| PHP (phpspy) | Per phpspy | _[php] |
| .NET (dotnet-trace) | Per dotnet-trace | _[net] |
| Kernel (perf, async-profiler, PyPerf) | Function name | _[k] |
Please refer to the building section.
We welcome all feedback and suggestion through Github Issues:
- Update
__version__in__init__.py. - Create a tag with the same version (after merging the
__version__update) and push it.
We recommend going through our contribution guide for more details.
- async-profiler by Andrei Pangin. See our fork.
- py-spy by Ben Frederickson. See our fork.
- bcc (for PyPerf) by the IO Visor project. See our fork.
- phpspy by Adam Saponara. See our fork.
- rbspy by the rbspy project. See our fork.
- dotnet-trace
- Datadog Agent Integrations for the Spark, YARN metrics
1: To profile native programs that were compiled without frame pointers, make sure you use the --perf-mode smart (which is the default). Read more about it in the Profiling options section↩