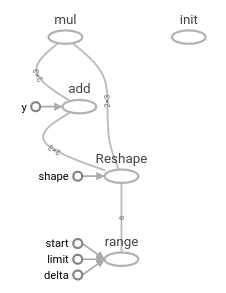
This is the very first version of numpyboard, which is inspired by tensorboard and is trying to reuse tensorboard to visualize the numpy calculation in a graph mode. The idea is simply convert a numpy calculation to a tensorflow calculation, in the meanwhile, the script is automatically converted to the computational graph and get displayed. Some issues, there're some calculation that doesnt work well in terms of the definition of 2 heterogeneous libraries. 2 tricky ways are applied to translate the codes.
- 1 simply replace the function name to equivalent functions, these replacements could be defined based on rules.
- 1.1 rename function (defined in Numpy)
# in SyntaxMapping.__init__()
{"arange": "range"}- 1.2 reconstruct function and parameters
# in SyntaxMapping.__init__()
{"'#1'.reshape('#2','#3')": "tf.reshape('#1',['#2','#3'])"}- 2 using some wrap library to handle the translation (This is still to be worked out)
e.g. followings codes:
import numpy as np

a = np.arange(6)
a = a.reshape(2,3*1)
a = (a + 100) * a
will be translated into:
import tensorflow as tf
a = tf.range(6)
b = tf.reshape(a, [2, (3 * 1)])
a = ((a + 100) * a)

logDir = "/home/eric/test"
sess = tf.Session()
sess.run(tf.global_variables_initializer())
sess.run(a)
writer = tf.summary.FileWriter(logDir, sess.graph)
sess.close()
the image generated:
