Events-Vis: A Visual Summary of Spatio-Temporal Events that Preserves Areas and Neighborhoods in a 2D Plot
Final project for the bachelor's degree in Applied Mathematics in EMAp FGV. Spatio-temporal data is the set of 3D data with 2 space dimensions and one temporal. This type of data is useful in different domains, and the analysis of clusters is a prevalent task. However, the state-of-the-art techniques used, such as the Space-Time Cube and animations, present limitations when displaying this type of data. It can be caused by distortions of cognitive limitations of tracking changes. For that reason, we present Events-Vis, a visualization technique for Spatio-temporal data.
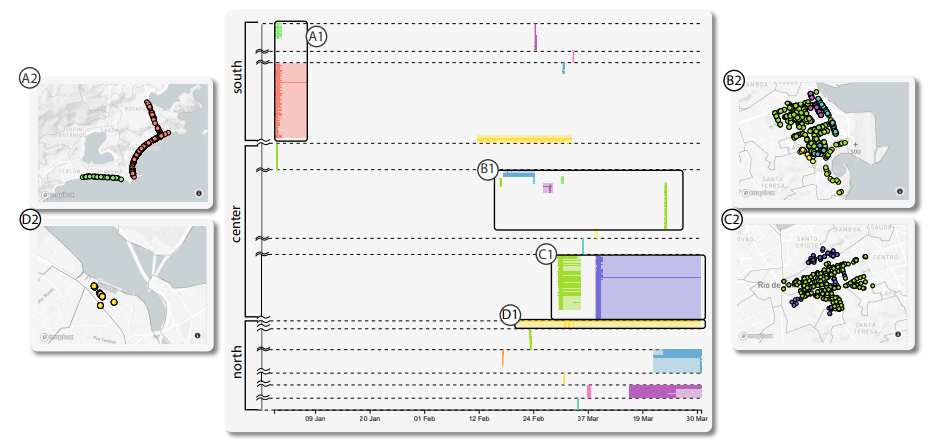
The result of Events-Vis is a 2D static plot, with the time in the horizontal direction, and the space is represented in the vertical. In that scenario, the dimension of the space must be transformed from 2D to 1D. We propose a reduction of dimensionality that considers the area of the clusters, their neighborhoods, and the general spatial distribution using a greedy algorithm and a convex optimization method. We also implemented a visualization tool that uses our method and links it with other panels of interactivity. This tool was used in the study case with data from traffic alerts at Rio de Janeiro. The complete discussion about our method is available at the document.
The files of the project are separated into the following folders:
-
notebooks/: Jupyter Notebooks used in the pre-processing of data, generation of fake data, and plots used on the text. -
scripts/: Python scripts that implement the Events-Vis method to be used on the visualization tool. -
app/: files for the web-page tool that calls the Events-Vis method. -
synthetic/: files for the web-page tool that evaluates the method. -
data/: files with the data used. -
presentations/: files for the presentations of the project. -
thesis/: LaTeX files to generate the final text.
It is necessary to have a Python installation; it was also used Anaconda support. Many libraries were used in the project; the list of all and their versions are available at the file enviroment.yml. To install all of them, in the Anaconda Prompt, run the following command:
conda env create -f enviroment.yml
You can run the Jupyter Notebooks, first enter on the Anaconda Prompt and run the commands:
conda activate events-vis
jupyter notebook
Than just run all the cells on the Notebooks. If you want to use the visualization tool, enter the Anaconda Prompt and run:
conda activate events-vis
cd app
set FLASK_APP=application.py
python -m flask run
Then enter on the URL at your browser http://127.0.0.1:5000/index. If you want to run the evaluation tool, just change the line cp app to cd synthetic.