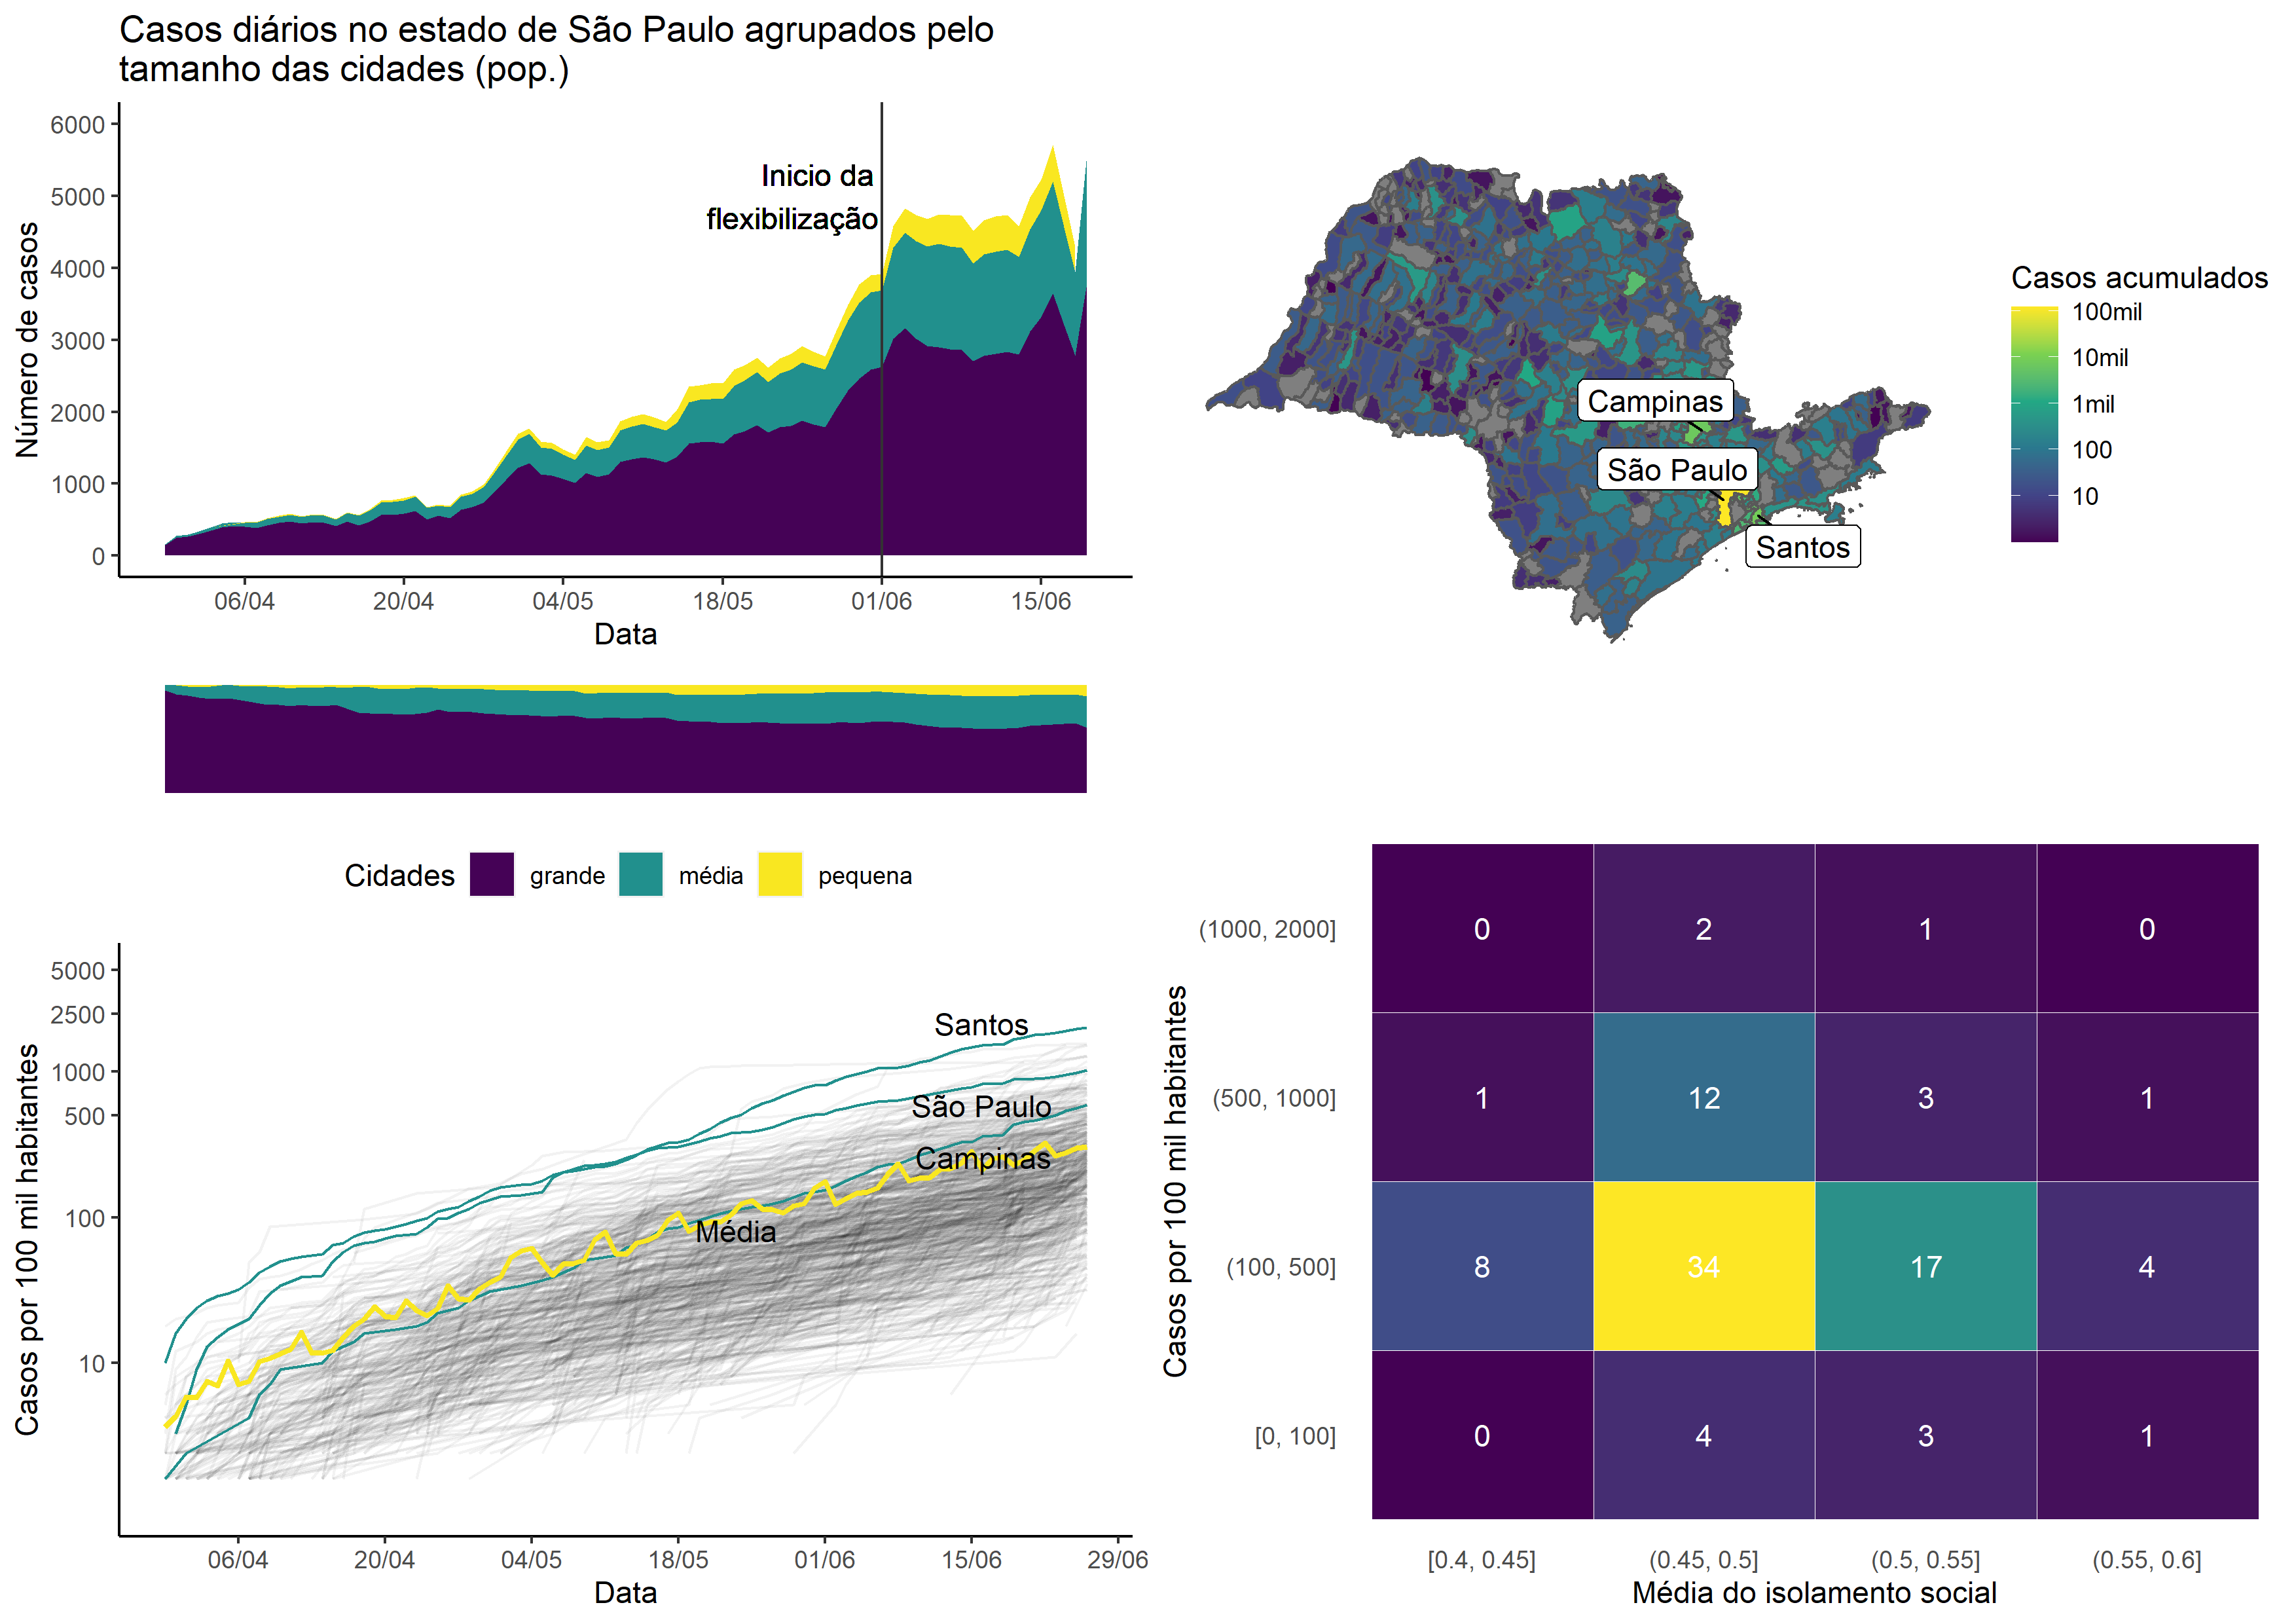
This project was made in the first semester of 2020 as the final work of the discipline of Exploratory Data Analysis and Visualization. The objective of the visualization was to comprehend the dissemination patterns of the COVID-19 cases in the first months of the pandemic, from April to June, in the cities of São Paulo (the state). The discussion about the development of the visualization and the results are available at the following link.
The files of the project are separated in the following folders:
-
/docs: files for the web site that contains the documentation of the visualization. -
script.Rmd: main file that generates both the documentation and the final figure.
The visualization was implemented with the R language and with R-studio support to generate the markdown file. The used libraries, that can easily installed with R-studio, are:
- ggplot
- sf
- geobr
- dplyr
- ggrepel
- grid
- gridExtra
- Run all the cells of the markdown
script.Rmdusing R-studio.