
![]()
GeoDS Lab, Department of Geography, University of Wisconsin-Madison.
Website
·
View Demo
- Citation
- About the Project
- Data Processing and Data Descriptor
- Dataset Structure
- How to Download Data?
- Field Descriptions
- License
- Contact
- Acknowledgements
If you use this dataset in your research or applications, please cite this source:
Kang, Y., Gao, S., Liang, Y. Li, M., Rao, J. and Kruse, J. Multiscale dynamic human mobility flow dataset in the U.S. during the COVID-19 epidemic. Scientific Data 7, 390 (2020). https://www.nature.com/articles/s41597-020-00734-5
@article{kang2020multiscale,
  title     = {Multiscale Dynamic Human Mobility Flow Dataset in the U.S. during the COVID-19 Epidemic},
  author    = {Kang, Yuhao and Gao, Song and Liang, Yunlei and Li, Mingxiao and Kruse, Jake},
  journal   = {Scientific Data},
  volumn    = {7},
  issue     = {390},
  pages     = {1--13},
  year = {2020}
}
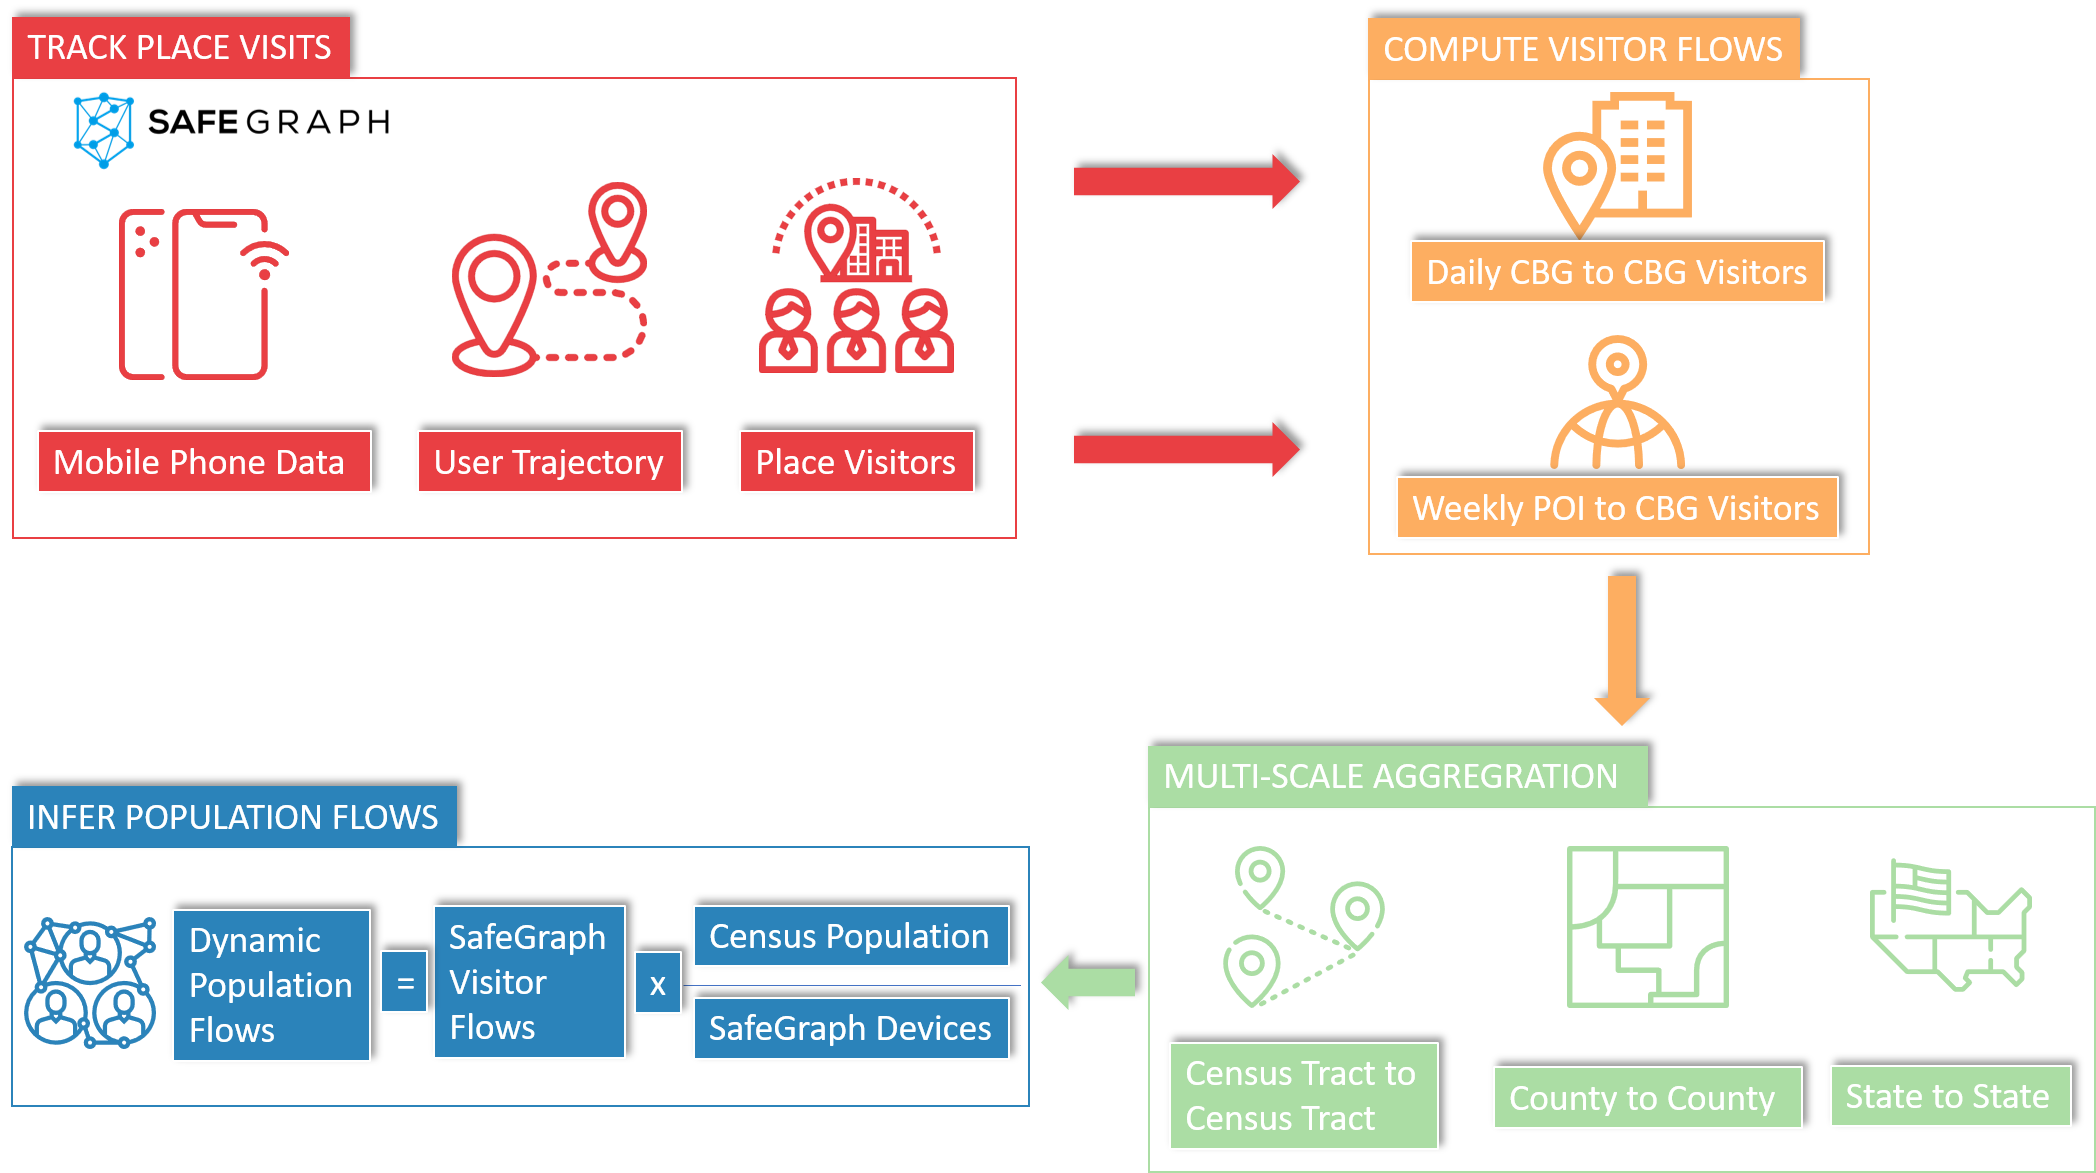
Understanding dynamic human mobility changes and spatial interaction patterns at different geographic scales is crucial for monitoring and measuring the impacts of non-pharmaceutical interventions (such as stay-at-home orders) during the pandemic. In this data descriptor, we introduce an up-to-date multiscale dynamic human mobility flow dataset across the United States, with data starting from January 1st, 2019. By analyzing millions of anonymous mobile phone users’ visit trajectories to various places provided by SafeGraph, the daily and weekly dynamic origin-to-destination (O-D) population flows are computed, aggregated, and inferred at three geographic scales: census tract, county, and state. There is high correlation between our mobility flow dataset and openly available data sources, which shows the reliability of the produced data. Such a high spatiotemporal resolution human mobility flow dataset at different geographic scales over time may help monitor epidemic spreading dynamics, inform public health policy, and deepen our understanding of human behavior changes under the unprecedented public health crisis. This up-to-date O-D flow open data can support many other social sensing and transportation applications.
The data processing framework for the mobility flow dataset production:
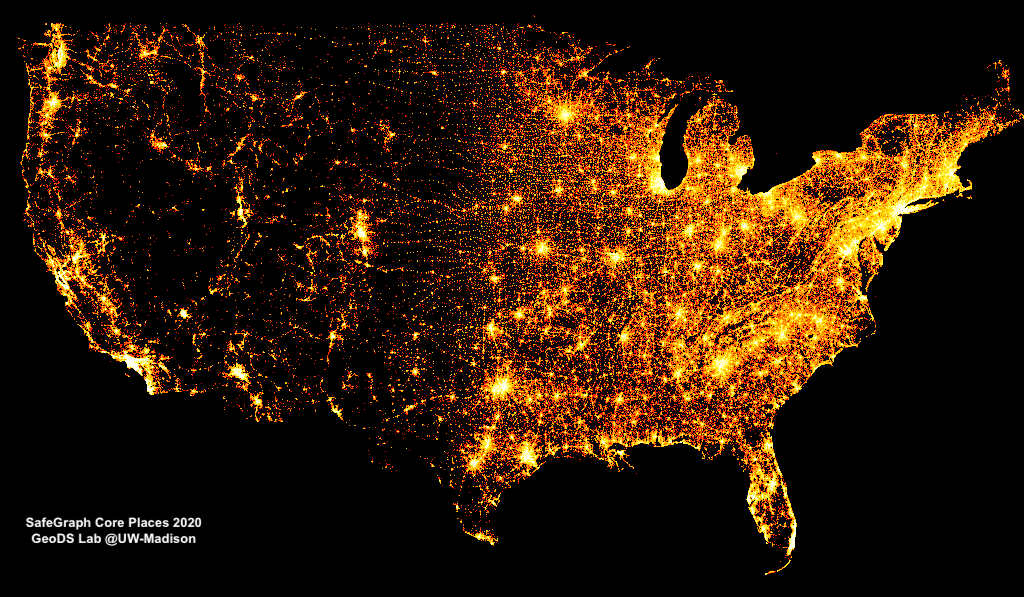
Spatial distribution of places collected by SafeGraph across the whole United States.
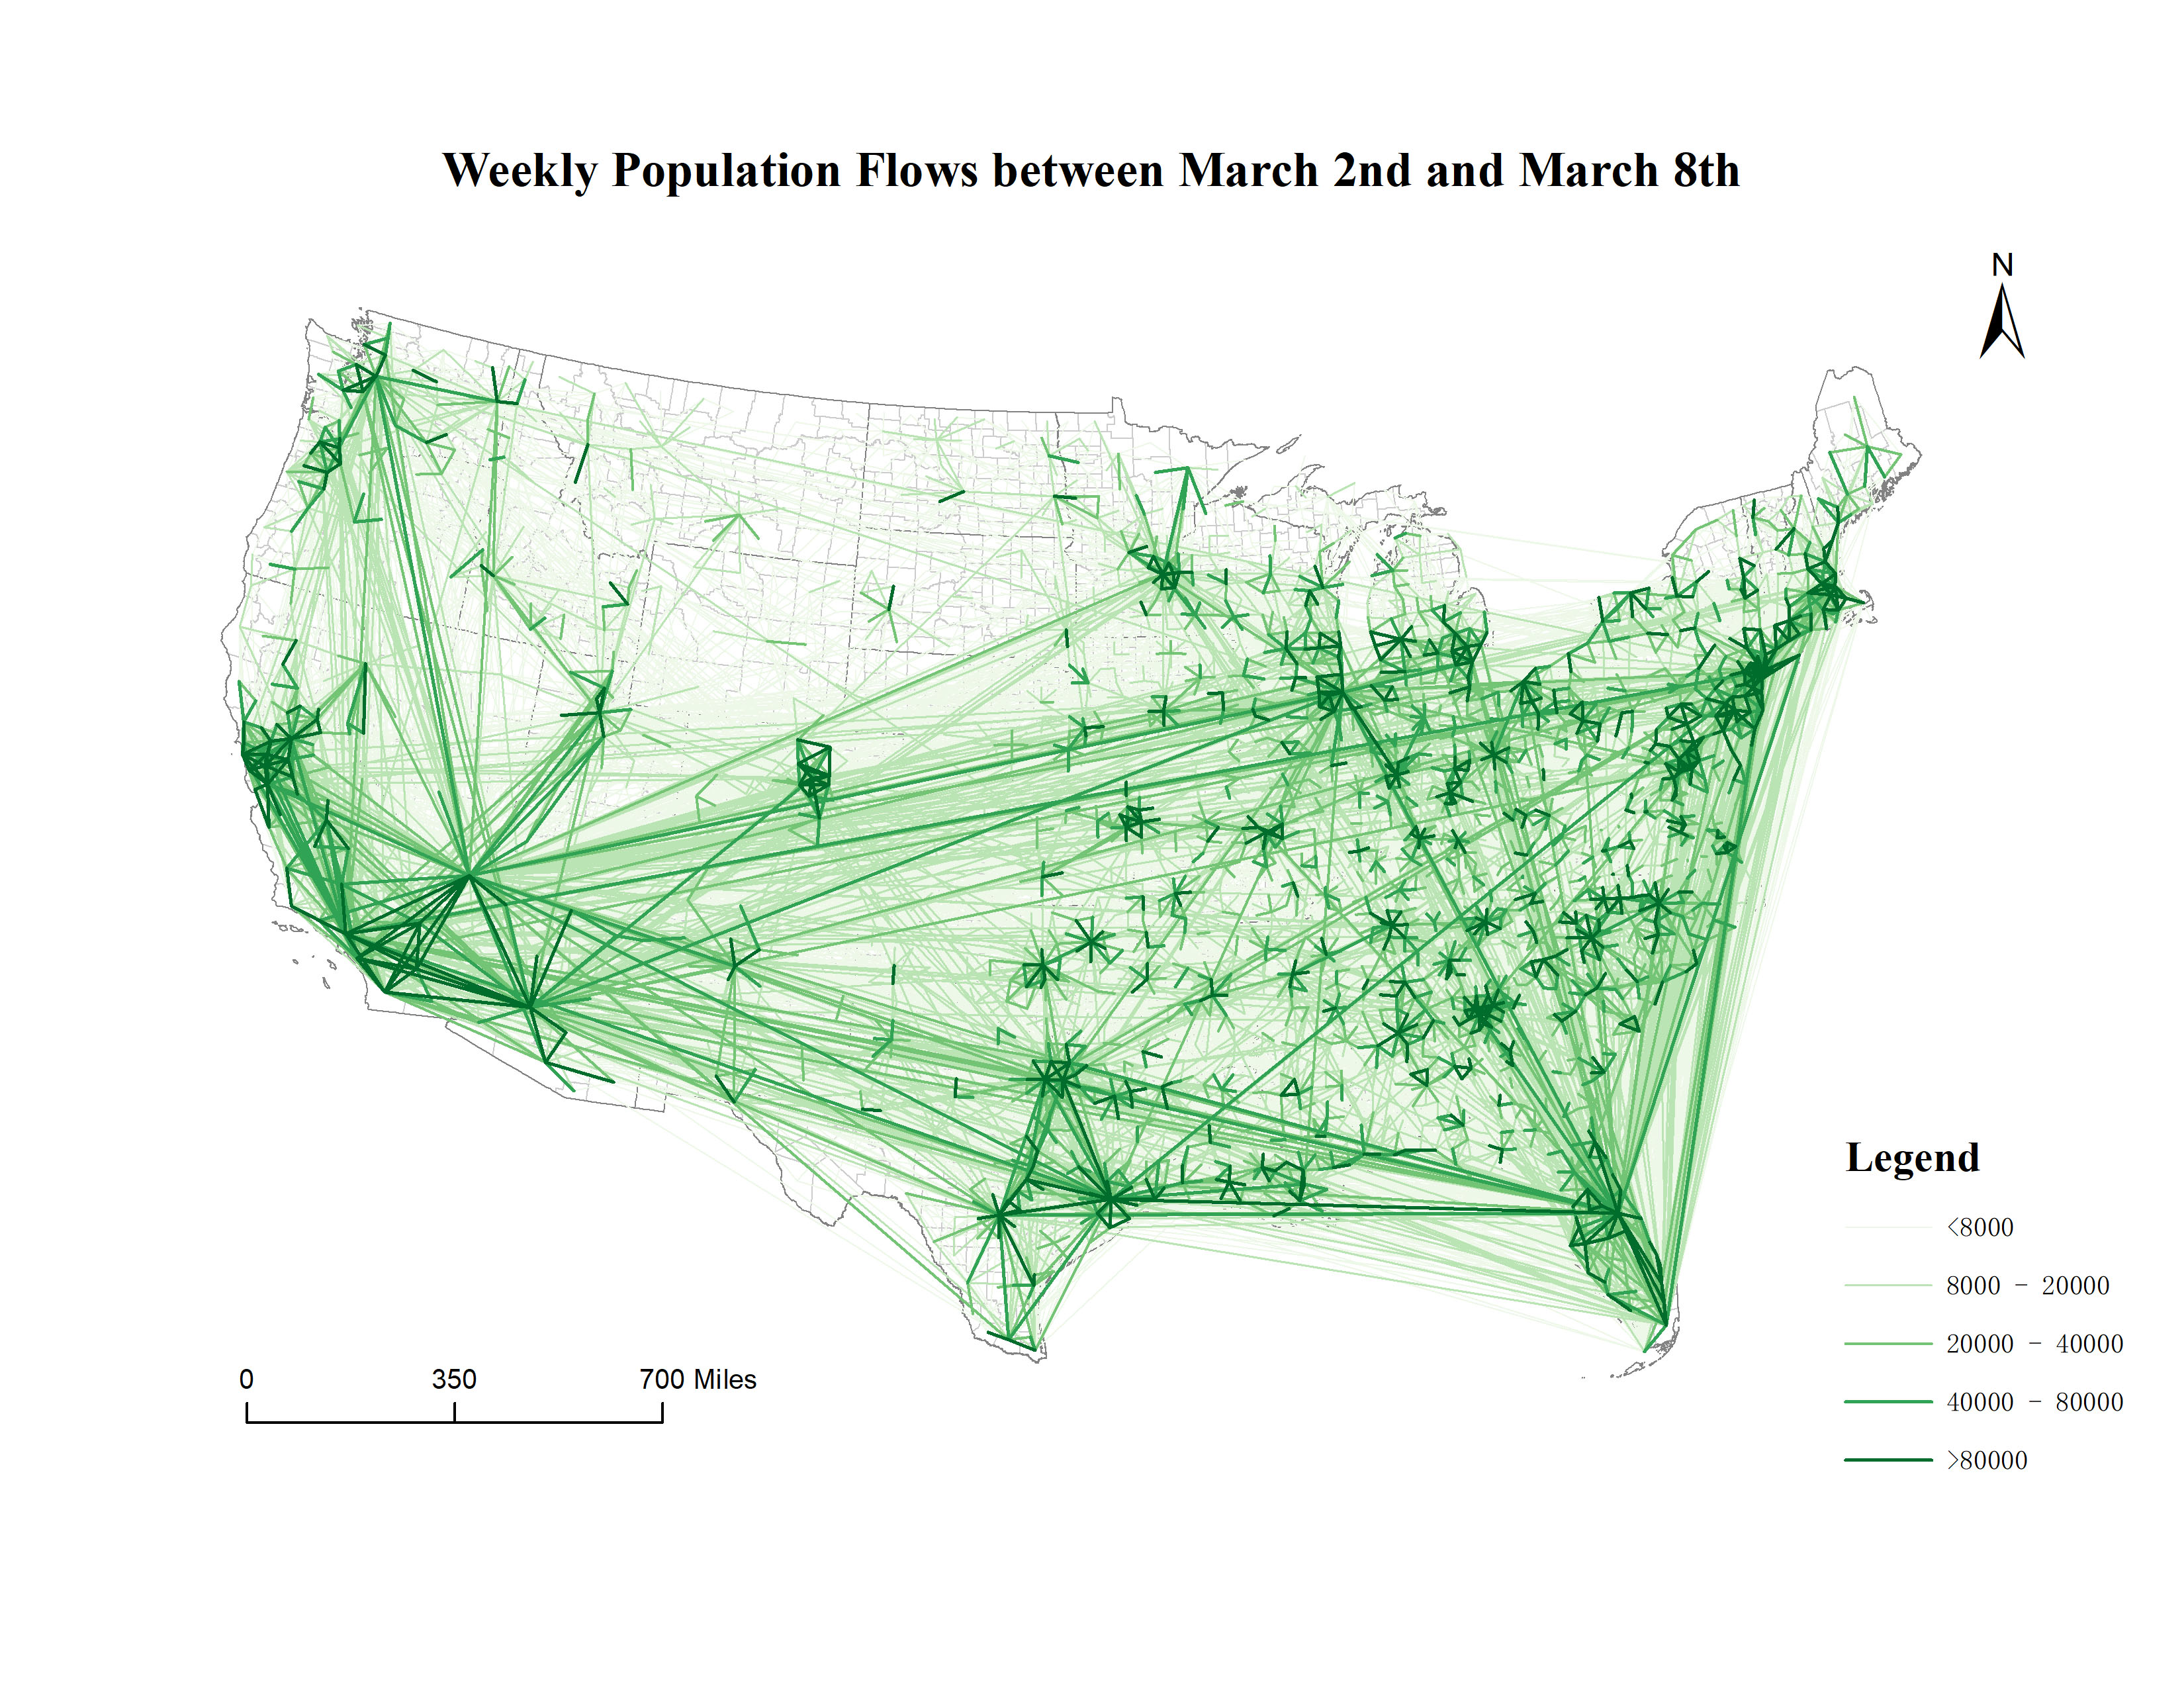
Spatial patterns of mobility flows during March 2nd to March 8th at the county to county level.
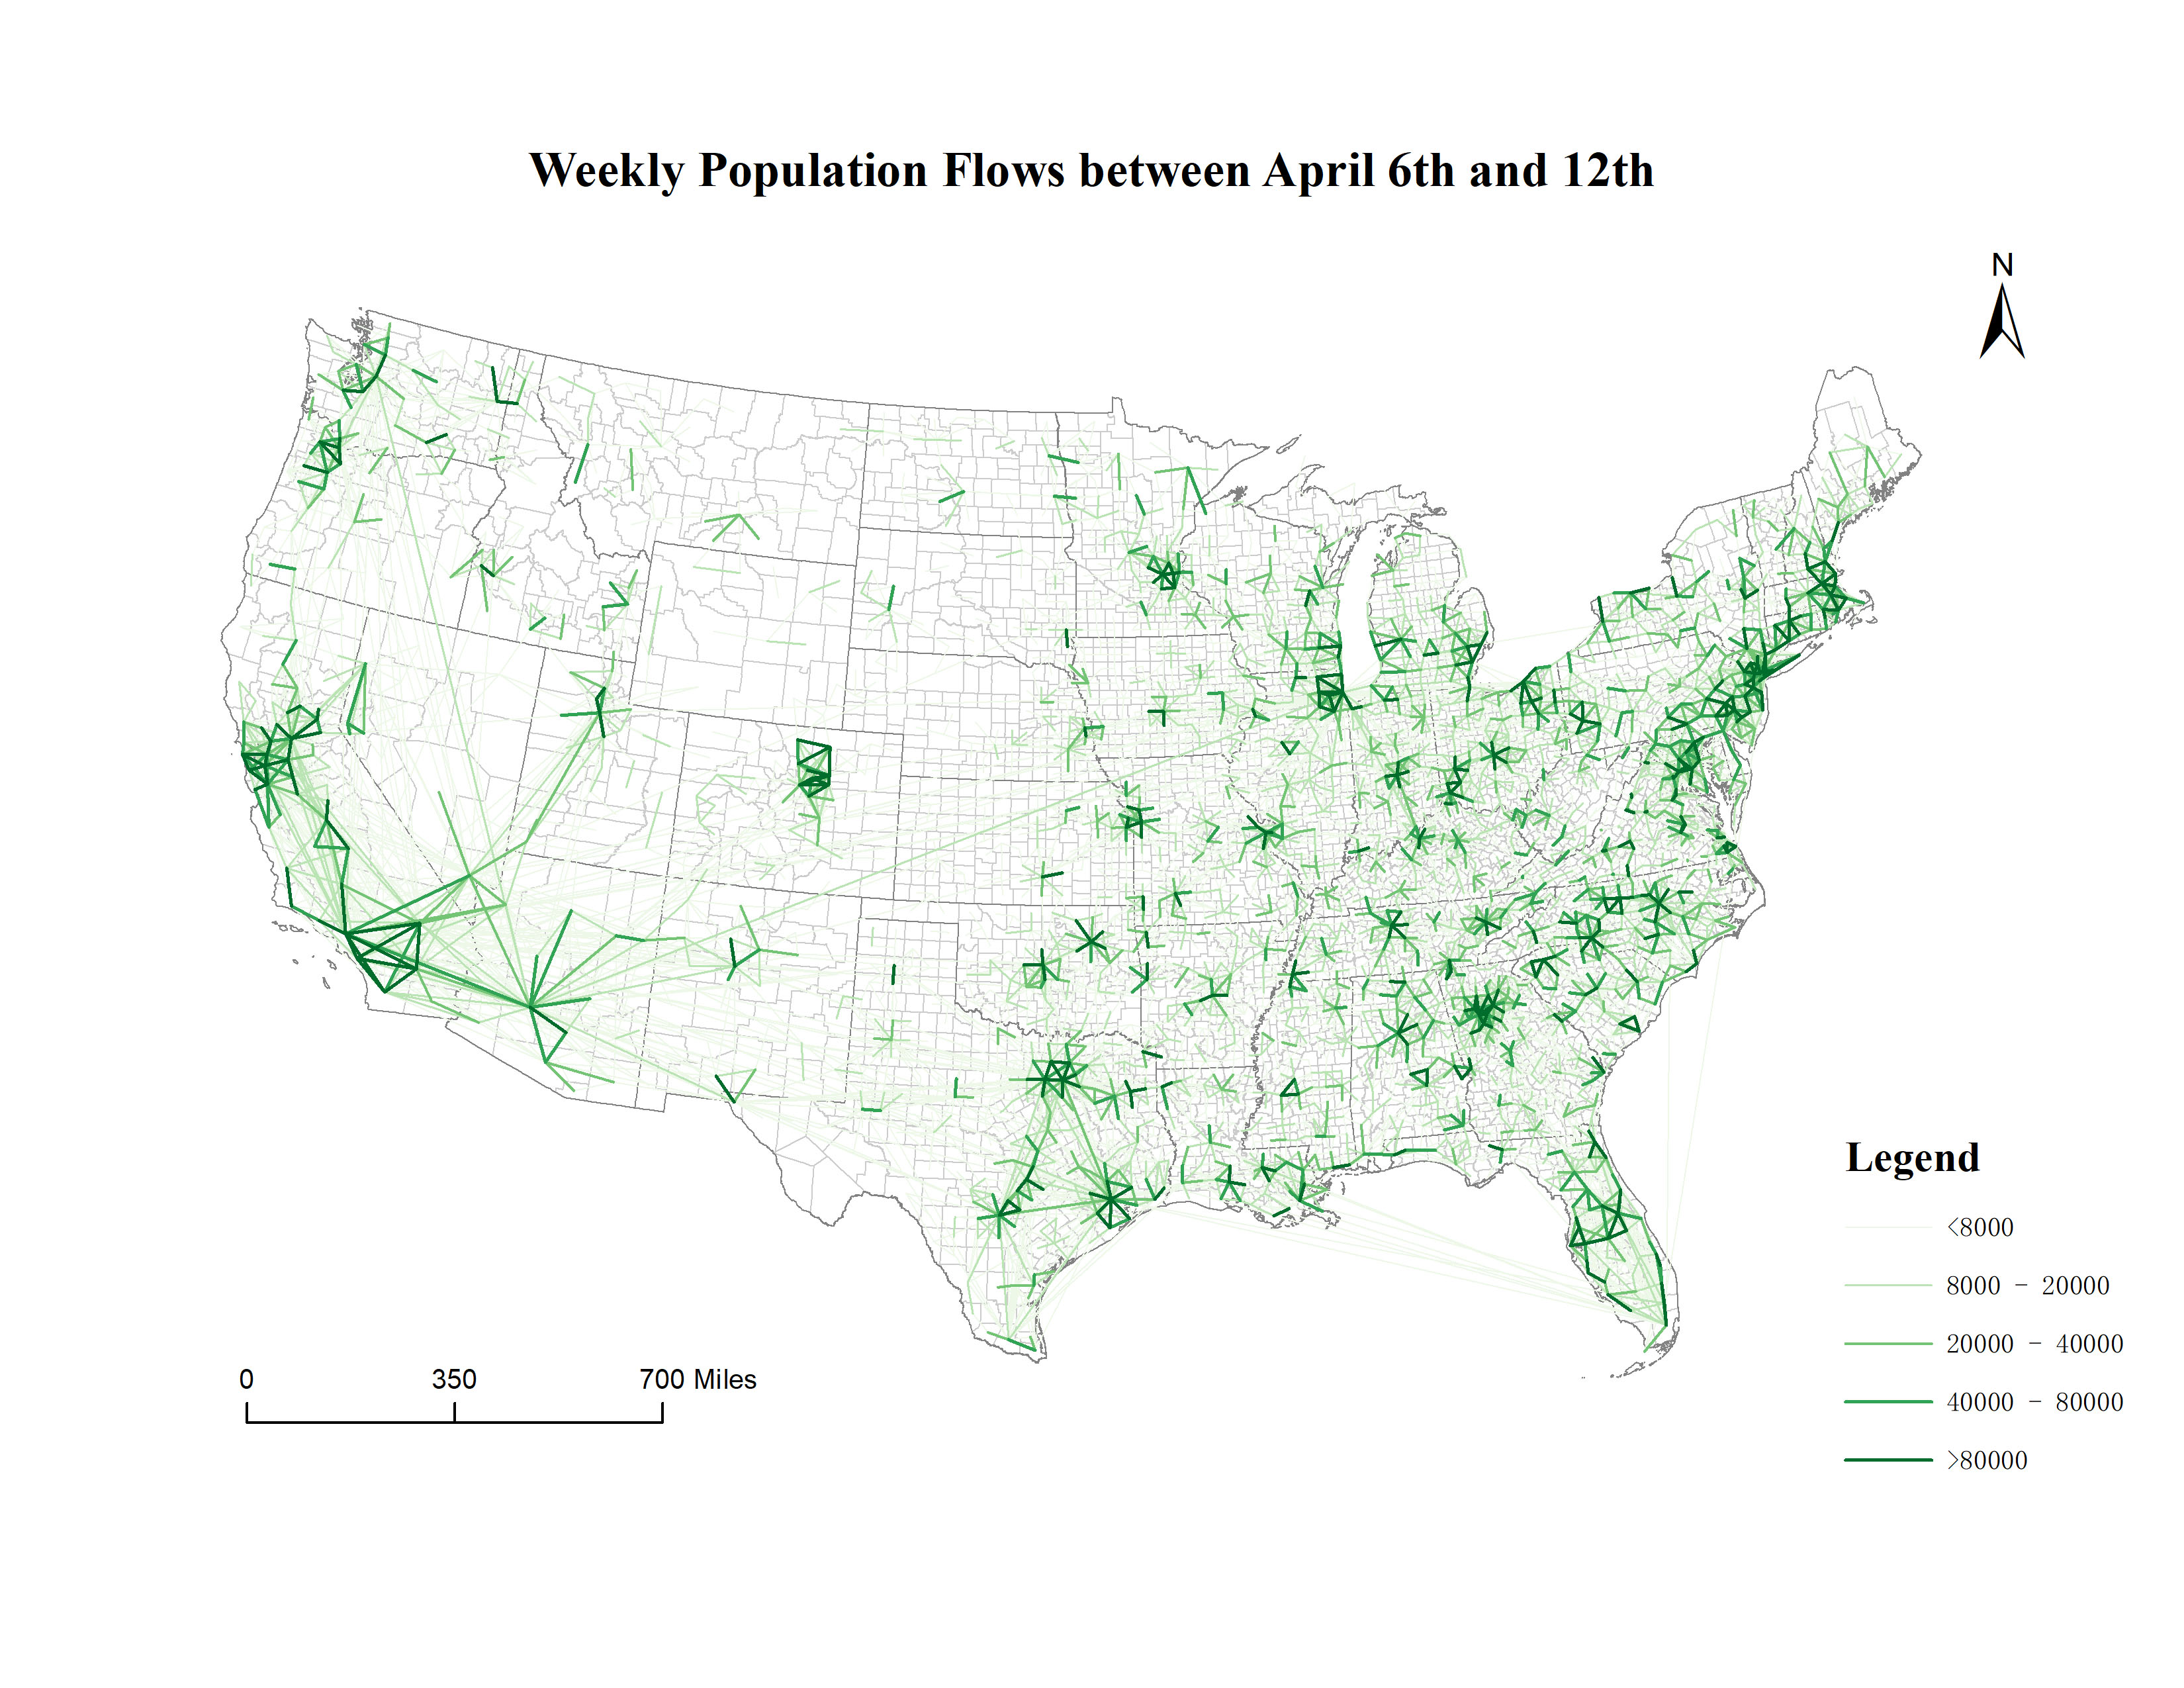
Spatial patterns of mobility flows during April 6th to April 12th at the county to county level.
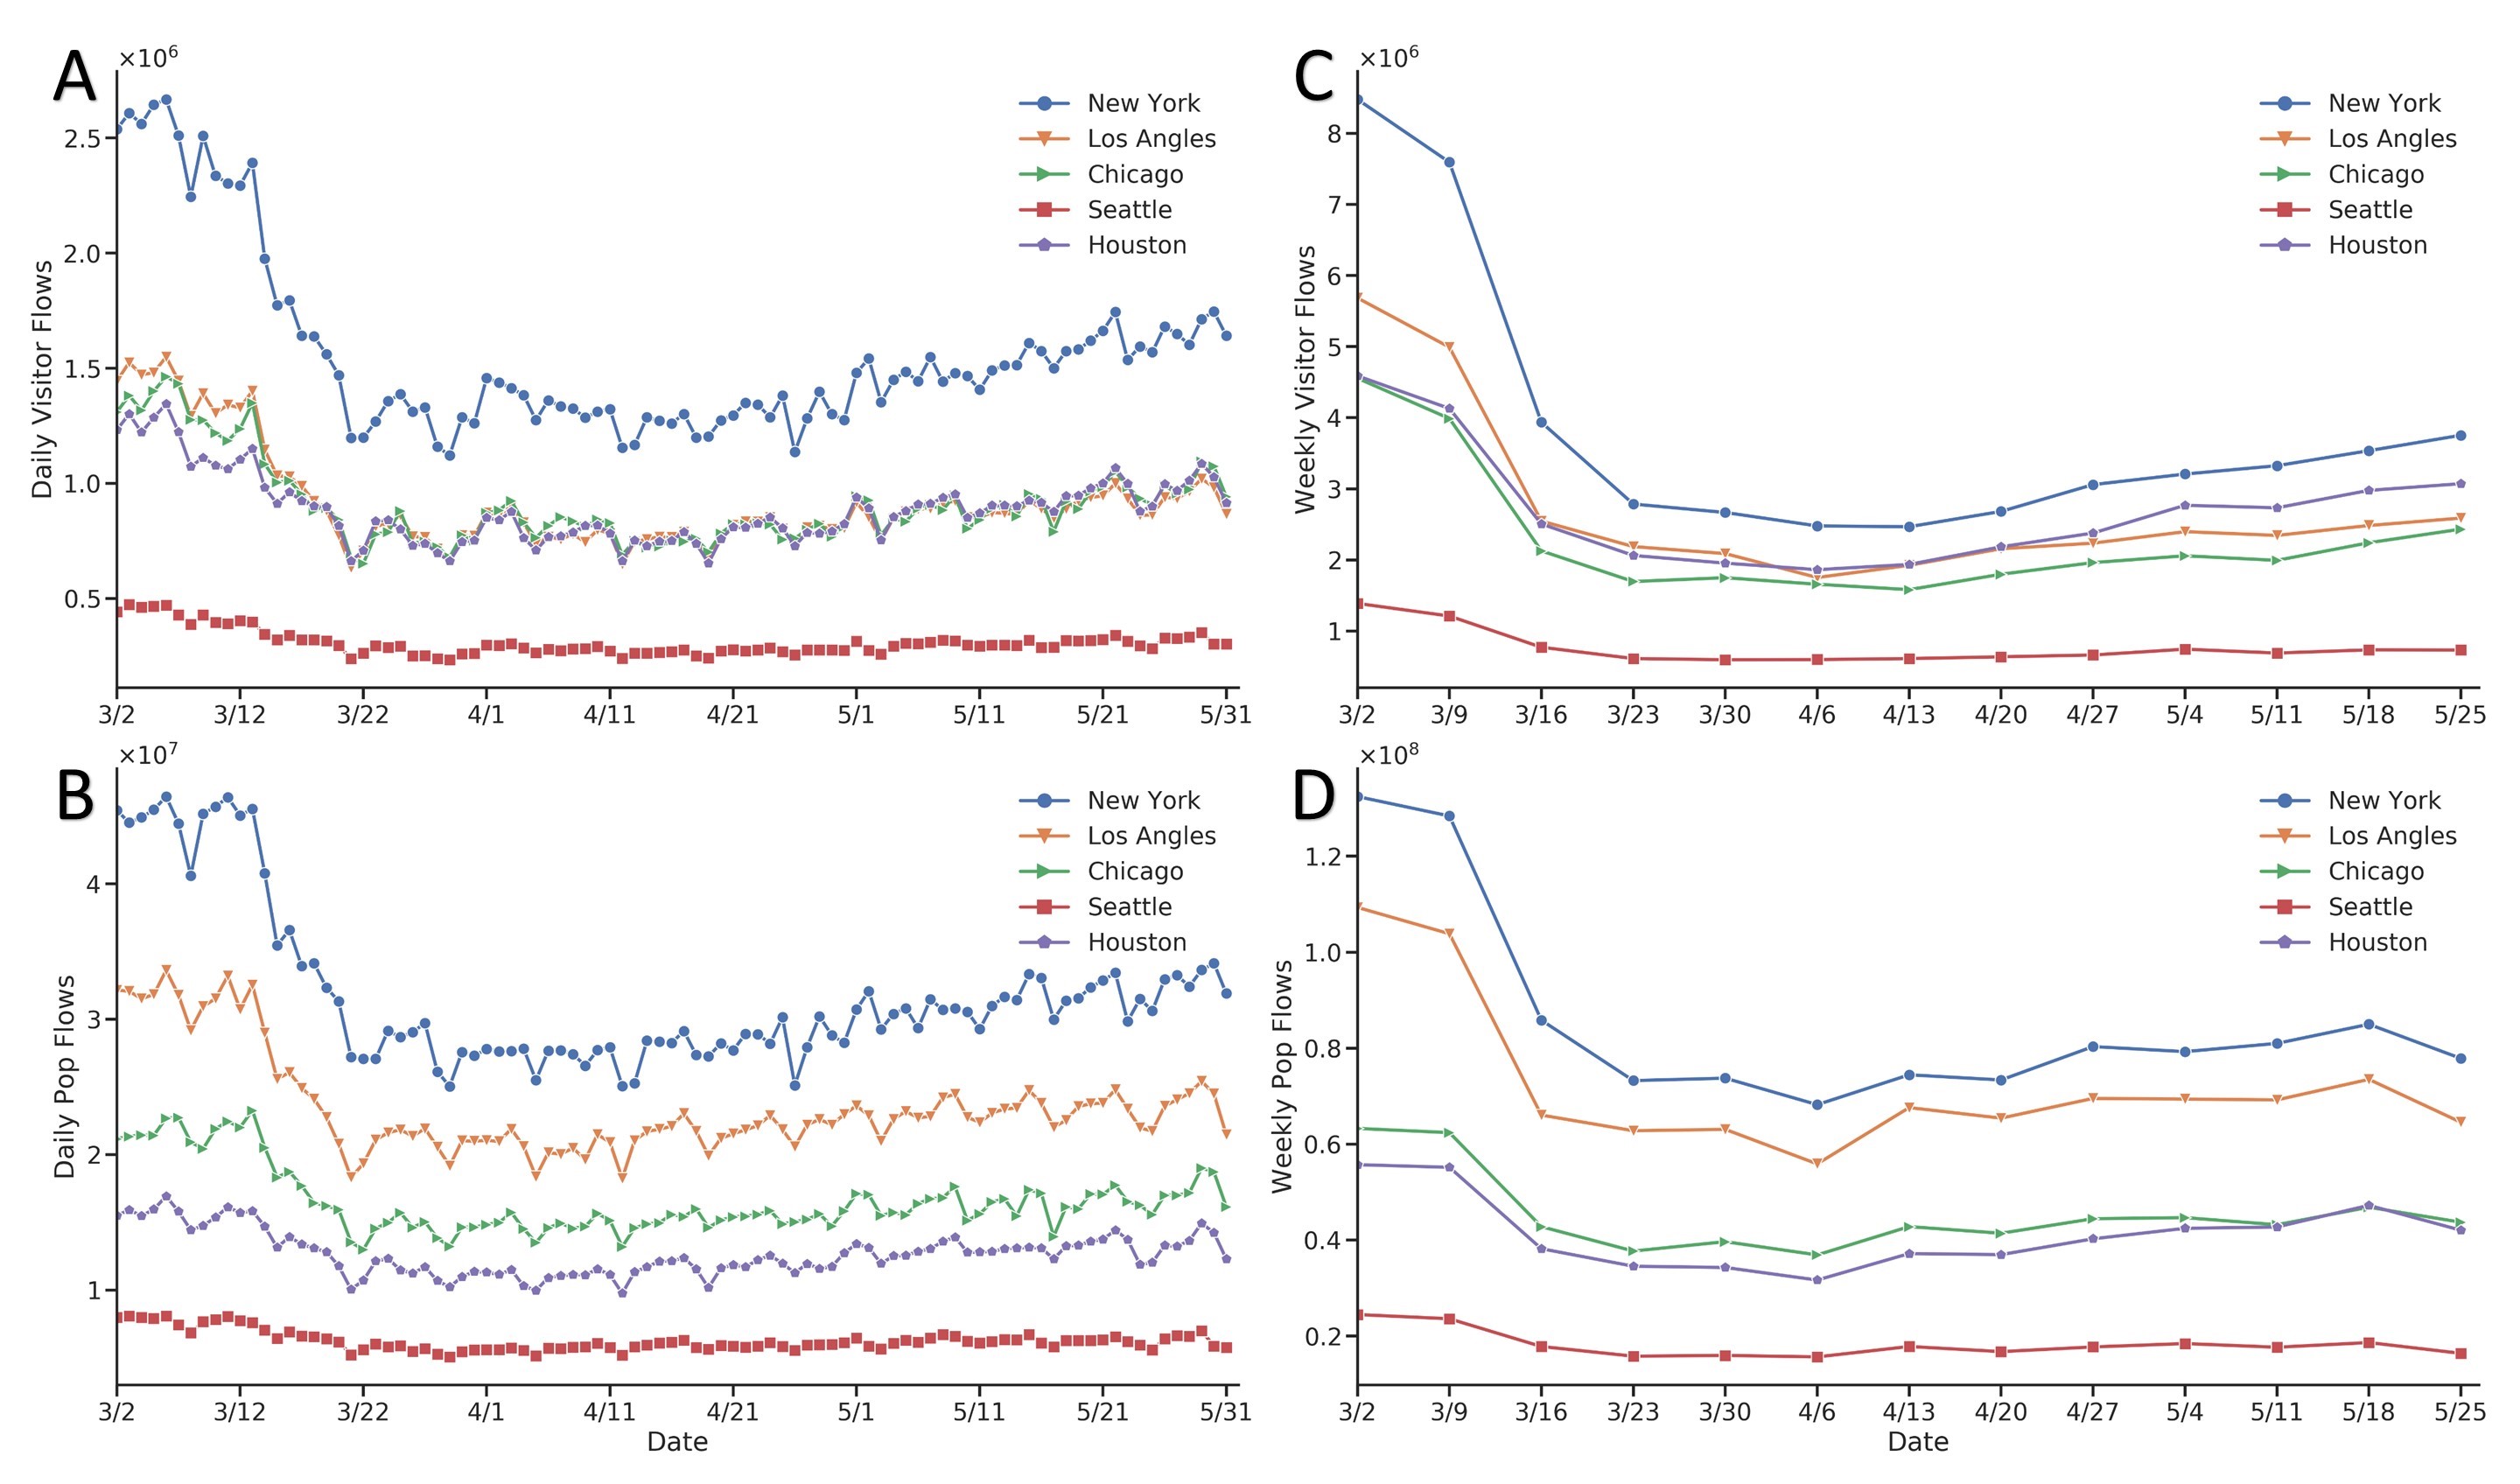
Temporal patterns of mobility flows in five metropolitan areas (just as examples; the data cover the whole US): New York, Los Angeles, Chicago, Seattle, and Houston. A: daily visitor flows; B: daily population flows; C: weekly visitor flows; D: weekly population flows. Date range: from March 2nd to May 31st, 2020.
A full description of the methodology used for this study can be found here: https://arxiv.org/abs/2008.12238.
Due to the data size restriction of GitHub, we have splitted our repository into a set of small data repositories. Each data repository follows the same folder structure but only contains part of the dataset. Here are the details about each repository:
| Data Repository | Data Type | Scale | Time Range |
|---|---|---|---|
| COVID19USFlows-WeeklyFlows | weekly data | state, county | 2019-2021 |
| COVID19USFlows-WeeklyFlows-Ct2019 | weekly data | census tract | 2019 |
| COVID19USFlows-WeeklyFlows-Ct2020 | weekly data | census tract | 2020 |
| COVID19USFlows-WeeklyFlows-Ct2021 | weekly data | census tract | 2021 |
| COVID19USFlows-DailyFlows | daily data | state, county | 2019-2021 |
| COVID19USFlows-DailyFlows-Ct2019-1 | daily data | census tract | 01/2019-04/2019 |
| COVID19USFlows-DailyFlows-Ct2019-2 | daily data | census tract | 05/2019-08/2019 |
| COVID19USFlows-DailyFlows-Ct2019-3 | daily data | census tract | 09/2019-12/2019 |
| COVID19USFlows-DailyFlows-Ct2020-1 | daily data | census tract | 01/2020-04/2020 |
| COVID19USFlows-DailyFlows-Ct2020-2 | daily data | census tract | 05/2020-08/2020 |
| COVID19USFlows-DailyFlows-Ct2020-3 | daily data | census tract | 09/2020-12/2020 |
| COVID19USFlows-DailyFlows-Ct2021 | daily data | census tract | 01/2021-04/2021 |
Data provided in this repository are separated into two folders daily_flows and weekly_flows to store daily flow data and weekly flow data. The two folders are organized according to the geographic scale, where ct2ct indicates flows between census tract to census tract, county2county refers to flows between county to county, and state2state contains flow data originate from one state to others. All files are stored in a csv format, which has been widely used for storing, transferring, and sharing data in multiple domains. File names are formatted as {data_type} _ {spatial_scale}_ {date}.csv, e.g. weekly_county2county_2020_03_02.csv and daily_state2state_2020_04_19.csv. Specifically, for weekly flow data, the dates in file name refers to the date of the Monday in that week but summarize all mobility flows in that week from Monday to Sunday. Since the file size of flow data at census tract level exceeds the GitHub disk limit, each flow data file is split into 20 files, e.g. weekly_ct2ct_2020_03_02_01.csv.
The folders and files are organized as follows.
project
|-- codes
|-- daily_flows
|   |-- state2state
|   |   |-- daily_state2state_2020_03_01.csv
|   |   |-- daily_state2state_2020_03_02.csv
|   |   `-- ...
|   |-- county2county
|   |   |-- daily_county2county_2020_03_01.csv
|   |   |-- daily_county2county_2020_03_02.csv
|   |   `-- ...
|   `-- ct2ct
|       |-- 2020_03_01
|       |   |-- daily_ct2ct_2020_03_01_01.csv
|       |   |-- daily_ct2ct_2020_03_01_02.csv
|       |   `-- ...
|       |-- 2020_03_02
|       |   |-- daily_ct2ct_2020_03_02_01.csv
|       |   |-- daily_ct2ct_2020_03_02_02.csv
|       |   `-- ...
|       `-- ...
`-- weekly_flows
|   |-- state2state
|   |   |-- weekly_state2state_2020_03_02.csv
|   |   |-- weekly_state2state_2020_03_09.csv
|   |   `-- ...
|   |-- county2county
|   |   |-- weekly_county2county_2020_03_02.csv
|   |   |-- weekly_county2county_2020_03_09.csv
|   |   `-- ...
|   `-- ct2ct
|       |-- 2020_03_02
|       |   |-- weekly_ct2ct_2020_03_02_01.csv
|       |   |-- weekly_ct2ct_2020_03_02_02.csv
|       |   `-- ...
|       |-- 2020_03_09
|       |   |-- weekly_ct2ct_2020_03_09_01.csv
|       |   |-- weekly_ct2ct_2020_03_09_02.csv
|       |   `-- ...
|       `-- ...
`-- weekly_country_flows
    |-- country2state
    |   |-- weekly_country2state_2020_03_02.csv
    |   |-- weekly_country2state_2020_03_09.csv
    |   `-- ...
    |-- country2county
    |   |-- weekly_country2county_2020_03_02.csv
    |   |-- weekly_country2county_2020_03_09.csv
    |   `-- ...
    `-- country2ct
        |-- weekly_country2ct_2020_03_02.csv
        |-- weekly_country2ct_2020_03_09.csv
        `-- ...
How to Download Data?
We provide a set of tools for downloading data.
If you are Linux/Mac users, you can use wget/curl to download data files.
wget https://raw.githubusercontent.com/GeoDS/COVID19USFlows{repo_url}/master/{data_type}_flows/{spatial_scale}/{data_type}_{spatial_scale}_{date}.csv
curl https://raw.githubusercontent.com/GeoDS/COVID19USFlows{repo_url}/master/{data_type}_flows/{spatial_scale}/{data_type}_{spatial_scale}_{date}.csv --output output_file.csv
Example:
Download daily county level data of March 1st, 2020 using wget.
wget https://raw.githubusercontent.com/GeoDS/COVID19USFlows-DailyFlows/master/daily_flows/county2county/daily_county2county_2020_03_01.csv
You can also use the following python codes to download daily patterns and weekly patterns.
To download daily patterns at different spatial scales, you can use codes/download_daily_data.py with the specified date range.
Usage:
python download_daily_data.py --start_year [start_year] --start_month [start_month] --start_day [start_day] --end_year [end_year] --end_month [end_month] --end_day [end_day] --output_folder [output_folder] --ct --county --state
--start_year (required parameter), year of the start date
--start_month (required parameter), month of the start date
--start_day (required parameter), day of the start date
--end_year  month of the end date, default is the start_year
--end_month  month of the end date, default is the start_month
--end_day    day of the start date, default is the start_day
--output_folder (required), output folder
--ct download data at the census tract level
--county download data at the county level
--state download data at the state level
Example:
Download county level data of March 1st, 2020 to the daily_flows folder.
python download_daily_data.py --start_year 2020 --start_month 3 --start_day 1 --output_folder daily_flows --county
Download state level and census tract level data from March 1st to March 10th, 2020 to the daily_flows folder.
python download_daily_data.py --start_year 2020 --start_month 3 --start_day 1 --end_month 3 --end_day 10 --output_folder daily_flows --state --ct
To download weekly patterns at different spatial scales, you can use codes/download_weekly_data.py with the specified data range.
Please note that the start date and the end date must be Monday.
Usage:
python download_weekly_data.py --start_year [start_year] --start_month [start_month] --start_day [start_day] --end_year [end_year] --end_month [end_month] --end_day [end_day] --output_folder [output_folder] --ct --county --state
--start_year (required parameter), year of the start date (must be a Monday)
--start_month (required parameter), month of the start date (must be a Monday)
--start_day (required parameter), day of the start date (must be a Monday)
--end_year  year of the end date (must be a Monday), default is the start_year
--end_month  month of the end date (must be a Monday), default is the start_month
--end_day    day of the start date (must be a Monday), default is the end_day
--output_folder (required parameter), output folder
--ct download data at the census tract level
--county download data at the county level
--state download data at the state level
Example:
Download county level data of the week of March 2nd-8th, 2020 to the weekly_flows folder.
python download_weekly_data.py --start_year 2020 --start_month 3 --start_day 2 --output_folder weekly_flows --county
Download state level and census tract level data from the week of March 2st-8th, 2020 to the week of March 23th-29th to the weekly_flows folder.
python download_weekly_data.py --start_year 2020 --start_month 3 --start_day 2 --end_month 3 --end_day 23 --output_folder weekly_flows --state --ct
Please note that at census tract level, since file sizes are larger than 100 MB, we split them into 20 files, e.g. weekly_ct2ct_2020_03_02_01.csv.
To merge them together conveniently, we provide codes/merge_files.py to combine all files under one folder together.
Usage:
python merge_files.py -i [input_folder] -o [output_file_path]
-i input folder path
-o output file path
Example:
Combine all census tract files under the folder ../weekly_flows/ct2ct/2020_04_06 to a single file weekly_ct2ct_2020_04_06.csv
python merge_files.py -i ../weekly_flows/ct2ct/2020_04_06/ -o weekly_ct2ct_2020_04_06.csv
A description of all attributes in the database is shown below:
geoid_o - Unique identifier of the origin geographic unit (census tract, county, and state). Type: string.
geoid_d - Unique identifier of the destination geographic unit (census tract, county, and state). Type: string.
lat_o - Latitude of the geometric centroid of the origin unit. Type: float.
lng_o - Longitude of the geometric centroid of the origin unit. Type: float.
lat_d - Latitude of the geometric centroid of the destination unit. Type: float.
lng_d - Longitude of the geometric centroid of the destination unit. Type: float.
date_range - Date range of the records. Type: string.
visitor_flows - Estimated number of visitors detected by SafeGraph between the two geographic units (from geoid_o to geoid_d). Type: float.
pop_flows - Estimated population flows between the two geographic units (from geoid_o to geoid_d), inferred from visitor_flows. Type: float.
geoid_o - Unique identifier of the origin geographic unit (census tract, county, and state). Type: string.
geoid_d - Unique identifier of the destination geographic unit (census tract, county, and state). Type: string.
lat_o - Latitude of the geometric centroid of the origin unit. Type: float.
lng_o - Longitude of the geometric centroid of the origin unit. Type: float.
lat_d - Latitude of the geometric centroid of the destination unit. Type: float.
lng_d - Longitude of the geometric centroid of the destination unit. Type: float.
date - Date of the records. Type: string.
visitor_flows - Estimated number of visitors between the two geographic units (from geoid_o to geoid_d). Type: float.
pop_flows - Estimated population flows between the two geographic units (from geoid_o to geoid_d), inferred from visitor_flows. Type: float.
We provide a new dataset that contains flows from other countries to U.S.
geoid_o - Two-letter country codes of the origin country. Type: string.
geoid_d - Unique identifier of the destination geographic unit in the United States (census tract, county, and state). Type: string.
lat_d - Latitude of the geometric centroid of the destination unit. Type: float.
lng_d - Longitude of the geometric centroid of the destination unit. Type: float.
visitor_flows - Estimated number of visitors detected by SafeGraph between the two geographic units (from geoid_o to geoid_d). Type: float.
date_range - Date range of the records. Type: string.
Distributed under the MIT License. See LICENSE for more information.
Song Gao - @gissong - song.gao at wisc.edu
Yuhao Kang - @YuhaoKang - yuhao.kang at wisc.edu
Project Link: https://github.com/GeoDS/COVID19USFlows
We would like to thank the funding support provided by the National Science Foundation (Award No. BCS-2027375). Any opinions, findings, and conclusions or recommendations expressed in this material are those of the author(s) and do not necessarily reflect the views of the National Science Foundation. Support for this research was partly provided by the University of Wisconsin - Madison Office of the Vice Chancellor for Research and Graduate Education with funding from the Wisconsin Alumni Research Foundation.