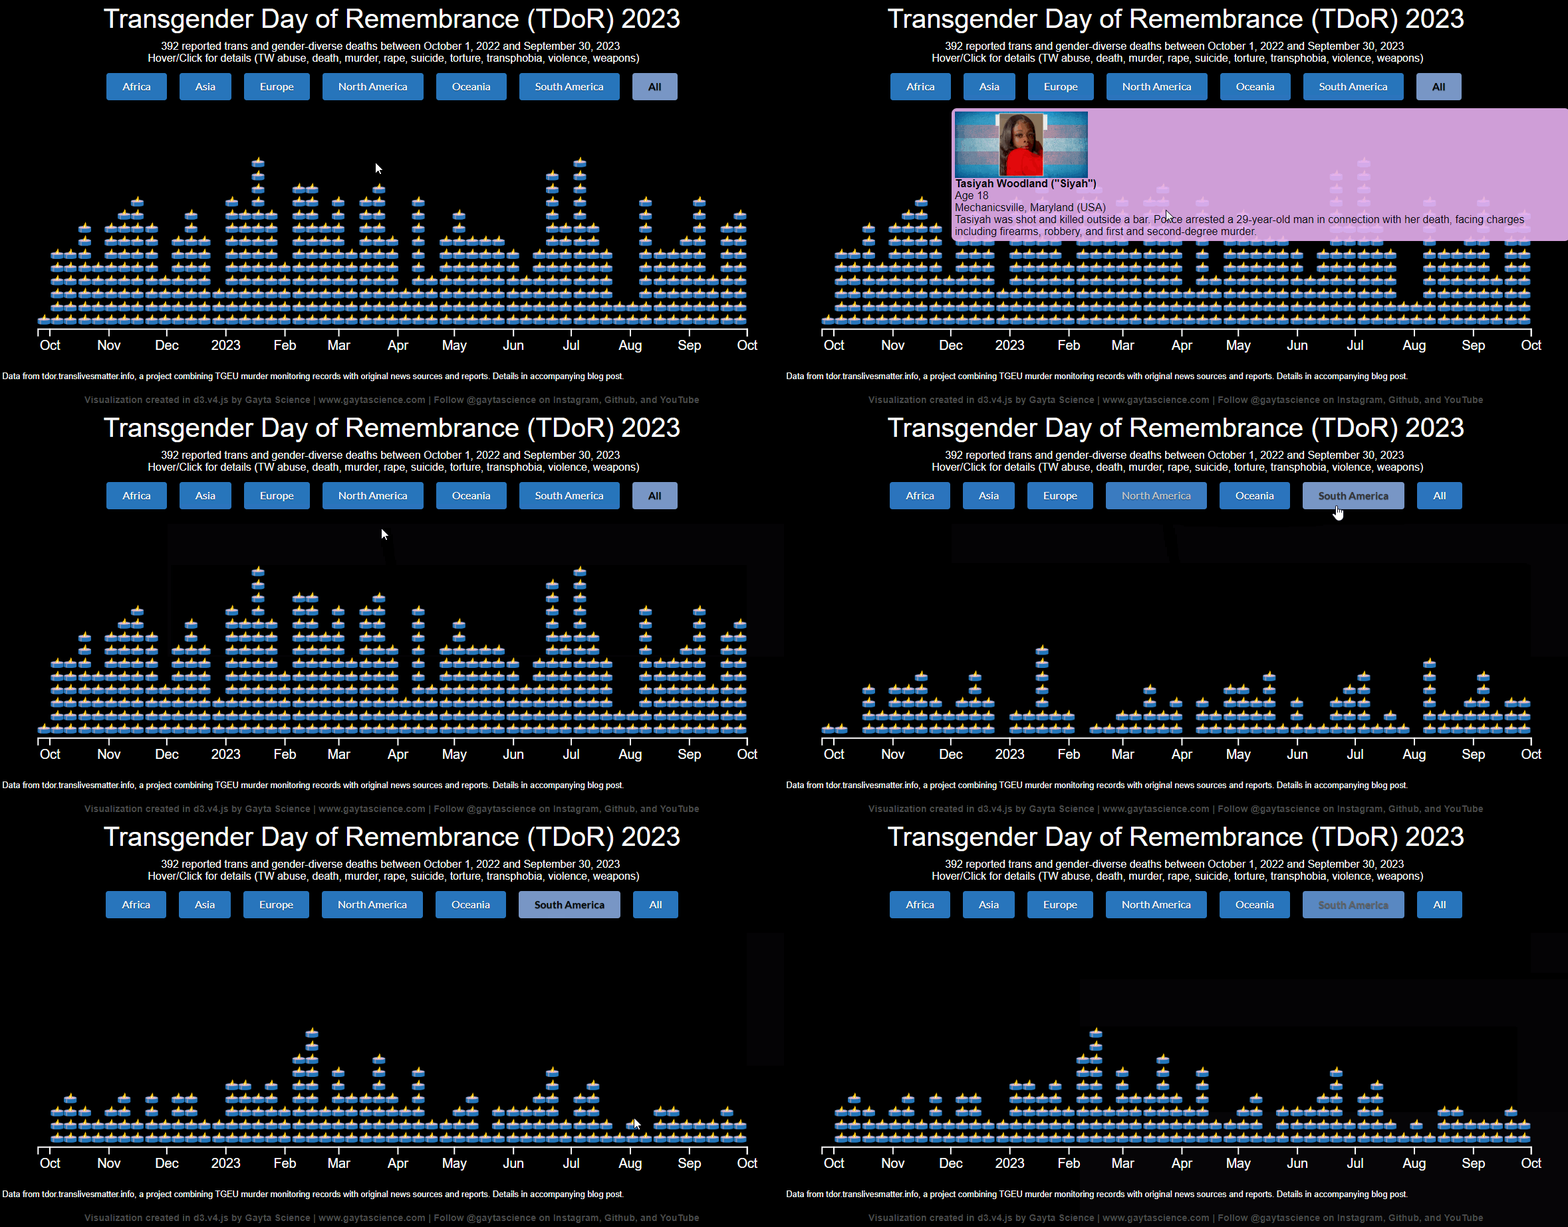
Data Visualization for Transgender Day of Remembrance (TDoR) 11/20
Trans Respect vs Transphobia Worldwide publishes reports for TDoR every year. One of the reports is a Name List, which lists available information for every reported murder of a trans or gender-diverse person in the last year.
In 2018, Anna-Jayne Metcalfe sought out to learn more about all those we have lost. The new https://tdor.translivesmatter.info/ website combines, gathers, and disseminates details about each victim’s life and death in a way that has not been available before, allowing the community to better connect with and celebrate them.
The 2017 data folder contains parsing scripts and data from the TGEU original reports, while all other years contain cleaned files pulled from https://tdor.translivesmatter.info/
The file dotbar.html contains the code for the d3.v4.js visualization (TW abuse, death, murder, rape, suicide, torture, transphobia, violence, weapons):
- Final Visualizations: 2023, 2022, 2021, 2020, 2019, 2018, 2017 (TGEU data only)
- Blog Post: https://www.gaytascience.com/tdor-dataviz/
Visualization can be built locally after cloning the repository. For example, to use a python simple server:
- In a terminal navigate to the repository folder (
cd [filepath]) - Start a simple server for local development. For Python 3 the command is
python -m http.server 8000 - In a browser go to http://localhost:8000/dotbar.html
- Files can now be edited locally with changes reflected when you refresh your browser page!
