scART: recognizing cell clusters and constructing trajectory from single-cell epigenomic data(https://www.biorxiv.org/content/10.1101/2023.04.08.536108v1.full)
scART is a Shen-lab in-house bioinformatics pipeline for single cell ATAC-seq (scATAC-seq). scART is a statistical and powerfule toolkit to liminate noise and select significant features for cell state recognition and lineage construction from sparse single-cell epigenetic data. Using a compendium of single cell ATAC-seq datasets, scART exploited for robust recognizion of cell types and relevant regulons, as well as achieved learning developing trajectory from single-cell epigenetic data. scART decodes the regulatory heterogeneity in cell populations and reconstructed cell fate transition.
The following packages have to be installed manually before installing scART:
if (!requireNamespace(c("chromVAR","GenomicFeatures","GenomicRanges","motifmatchr","JASPAR2018","textTinyR","Matrix","text2vec","irlba","Rtsne","densityClust","scales","ggplot2","data.table","ChIPseeker","uwot","ggpubr","cowplot","SummarizedExperiment","monocle","RColorBrewer","scatterplot3d")),quietly = TRUE)
install.packages(c("chromVAR","GenomicFeatures","GenomicRanges","motifmatchr","JASPAR2018","textTinyR","Matrix","text2vec","irlba","Rtsne","densityClust","scales","ggplot2","data.table","ChIPseeker","uwot","ggpubr","cowplot","SummarizedExperiment","monocle","RColorBrewer","scatterplot3d"))
Now, you are now ready to install scART:
library(scART)
data(scART_tutorail)art <- CreatescART(data,metadata = annotation)
# You can also use snap/10X output directory by Read_snap and Read_10X(Read_10X_h5) respectively.
# Or you can put the barcodes.tsv, bins.bed, matrix.mtx in a fold and provide Read_counts() with the fold address.
load('tutorial_data.Rdata')
art <- RunImputation(art,k=1)
art <- SparseFilter(art, ncell=2, ncell2=0.8, ncell3=2, nbin=10)
art <- RunSim(art)
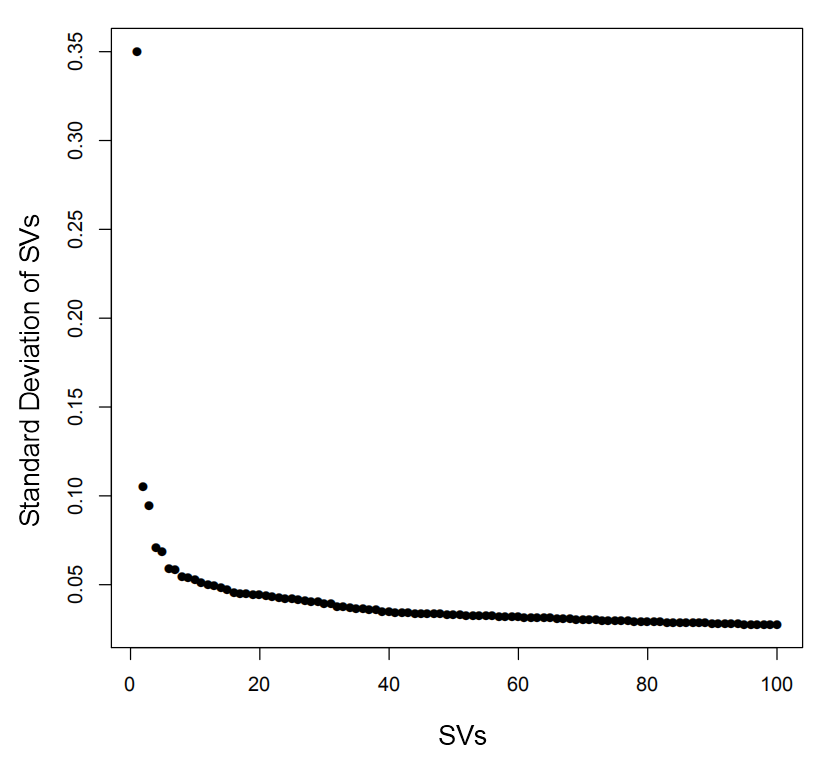
art <- DimReduce(art, n=150, num=100, scale=F)
You can take a good look at the output pdf to adjust 'rho_cutoff' and 'delta_cutoff'
set.seed(10)
art <- RunCluster(art,delta_cutoff = 11,rho_cutoff = 45)
set.seed(10)
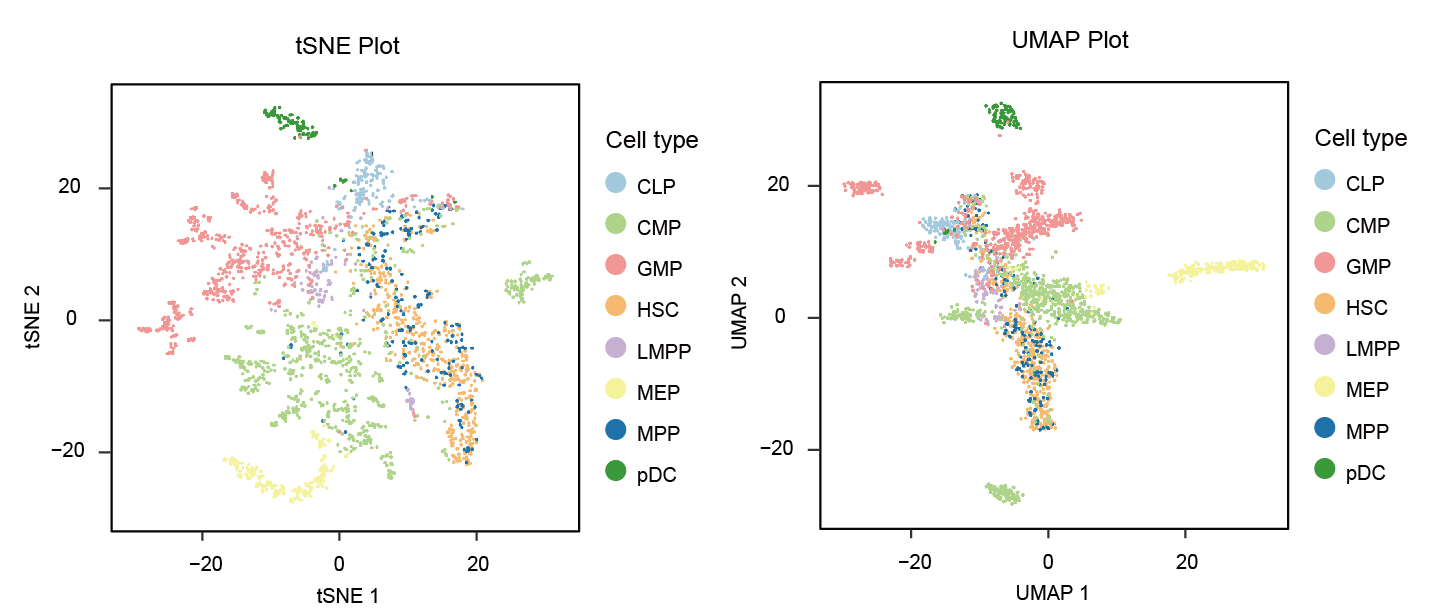
art <- RunTSNE(art, nSV=20, ndims=2, perplexity=30)
art <- RunUMAP(art)
p1 <- Visualization_2D(art,reductions = 'UMAP')
p2 <- Visualization_2D(art,reductions = 'TSNE')
library(patchwork)
p1|p2
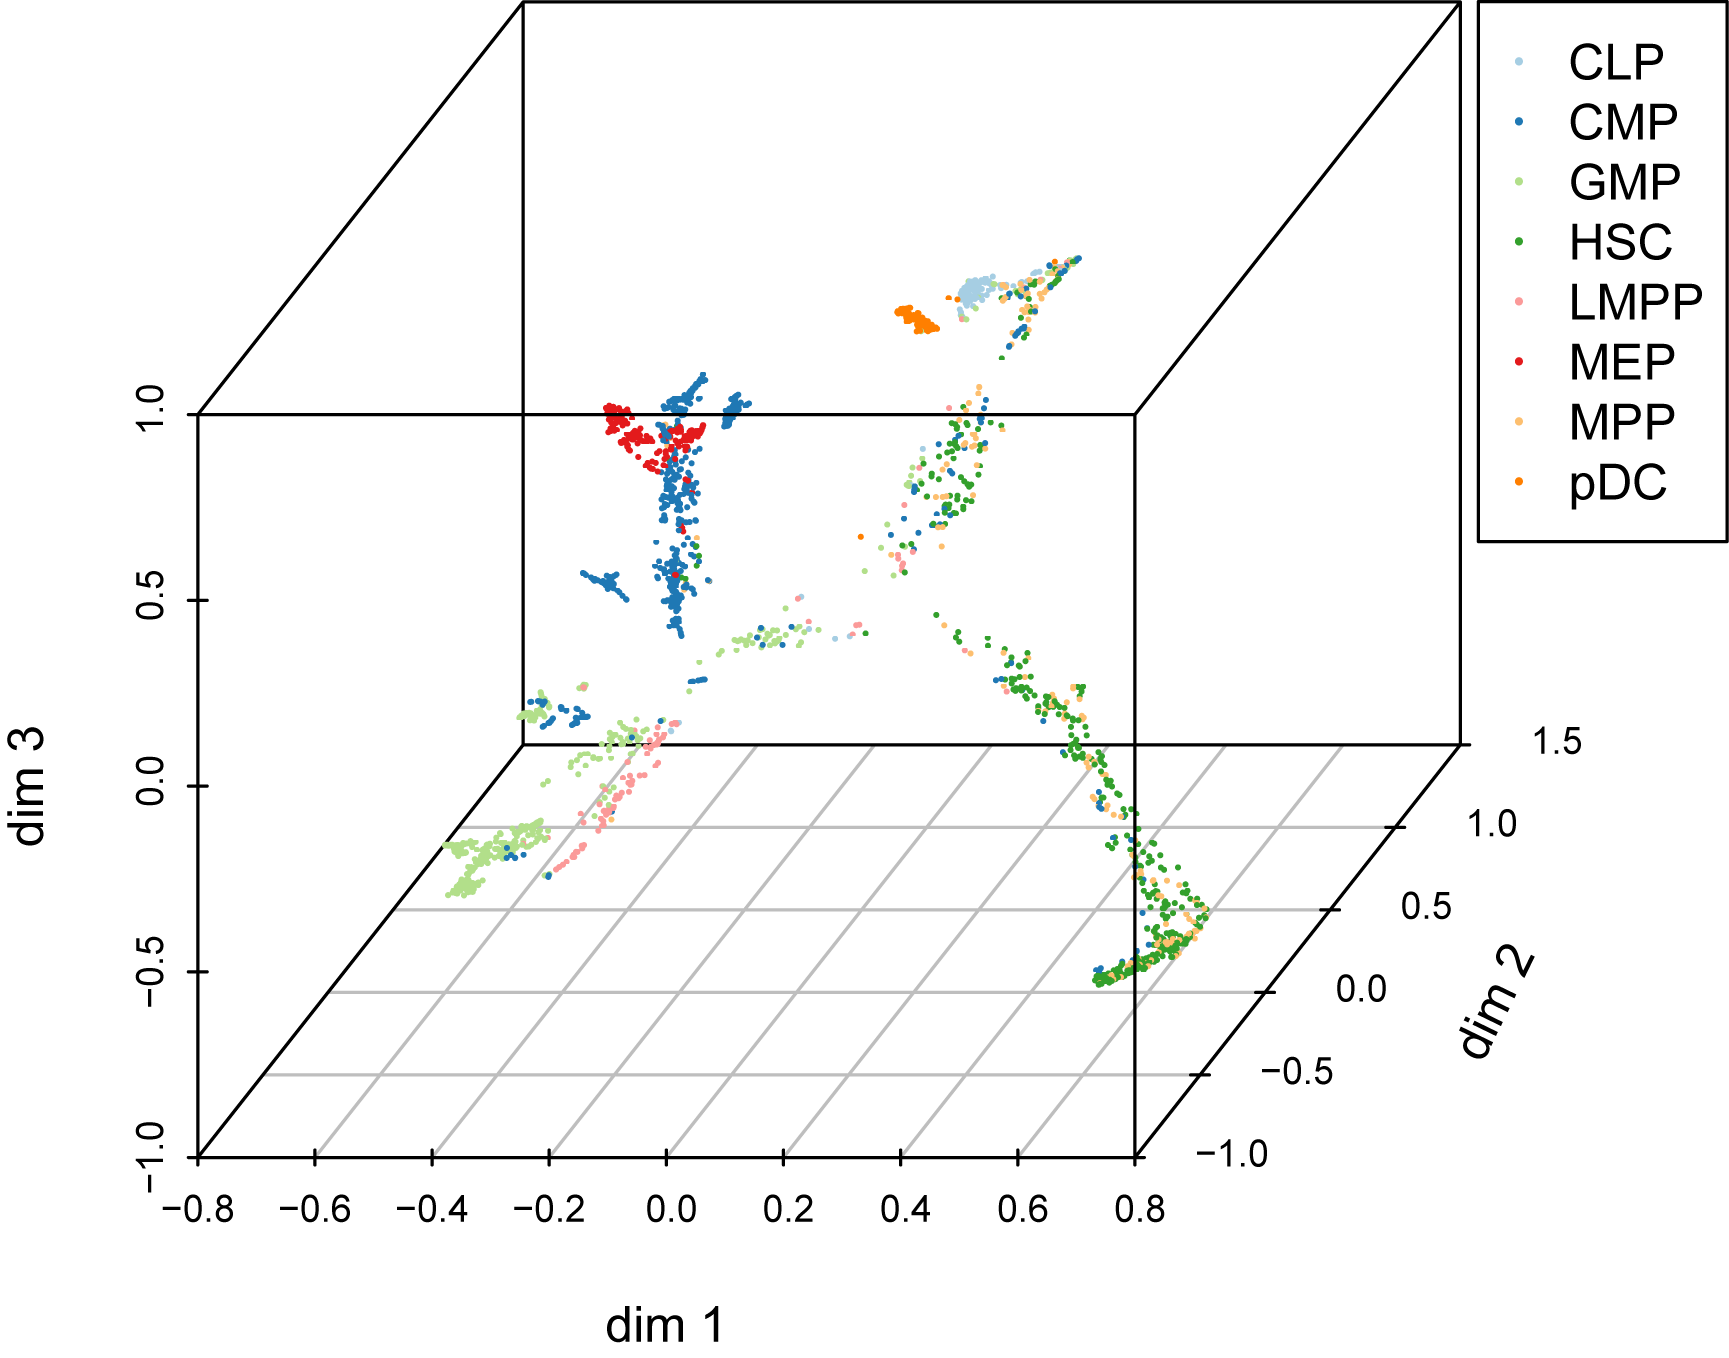
art <- RunTrajectory(art, anno='cell_type', nSV = 20, ndim= 3, gamma = 10)
plotTrajectory(art)
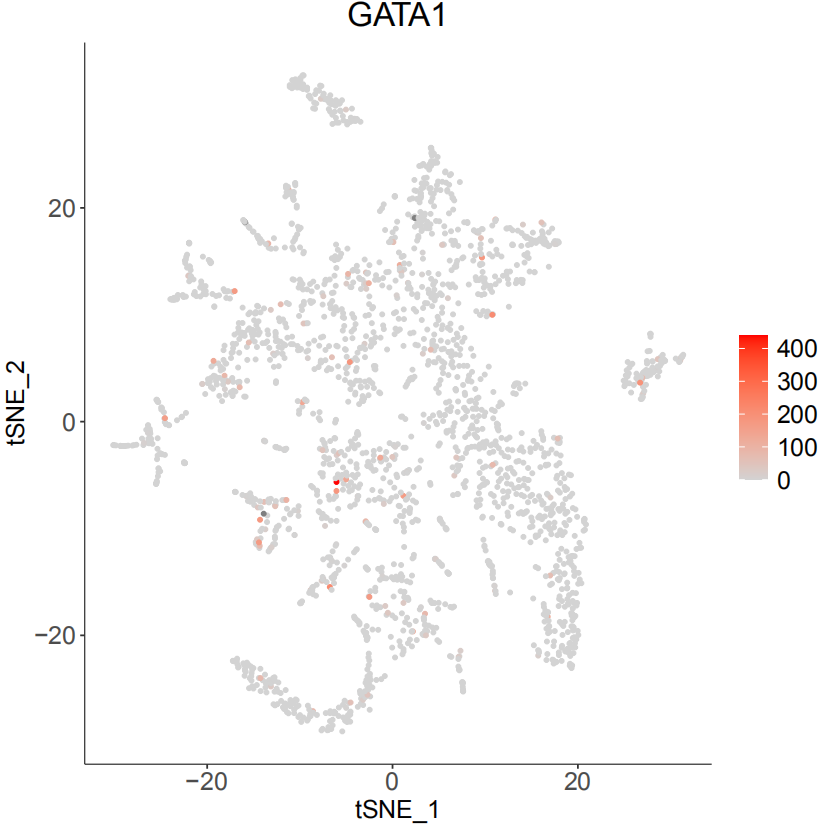
art <- MapBin2Gene(art, Org = 'hg19')
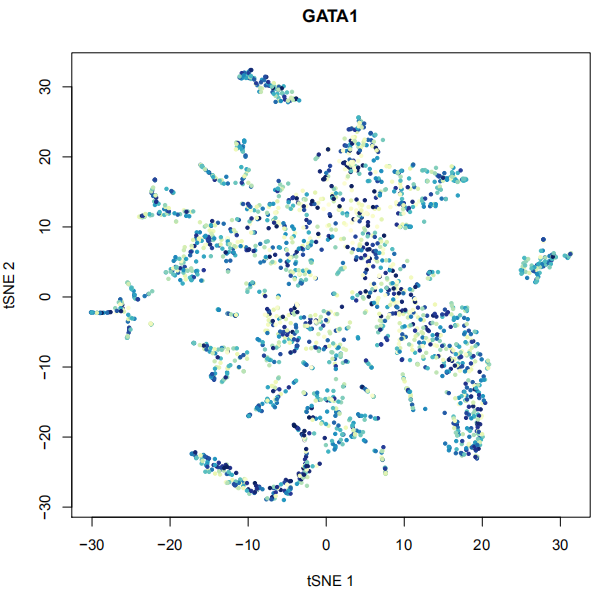
PlotSelectGenesATAC(art, gene2plot = c('GATA1','EBF1'))
art <- RunChromVAR(art,Org=c('hg19'),species = c("Homo sapiens") ,min.count=10)
PlotSelectTF(art,TF2plot=c('GATA1'))
### min.count:the threshold of a peaks found at at least 10 cells
save(art,'scart.Rdata')

