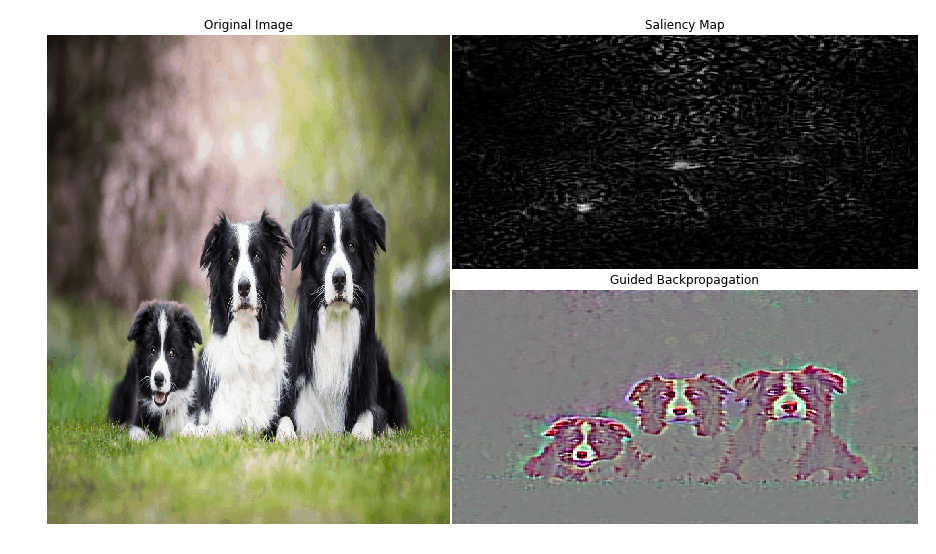
Saliency map is an image that shows each pixel's unique quality. The goal of a saliency map is to simplify and/or change the representation of an image into something that is more meaningful and easier to analyze. The Saliency map shows which pixels need to be changed the least to affect the class score the most. One can expect that such pixels correspond to the object location in the image. There are many implementations of this technique but here I shall be demonstrating the two most popular ones mainly Saliency Map, Guided Backpropagation .
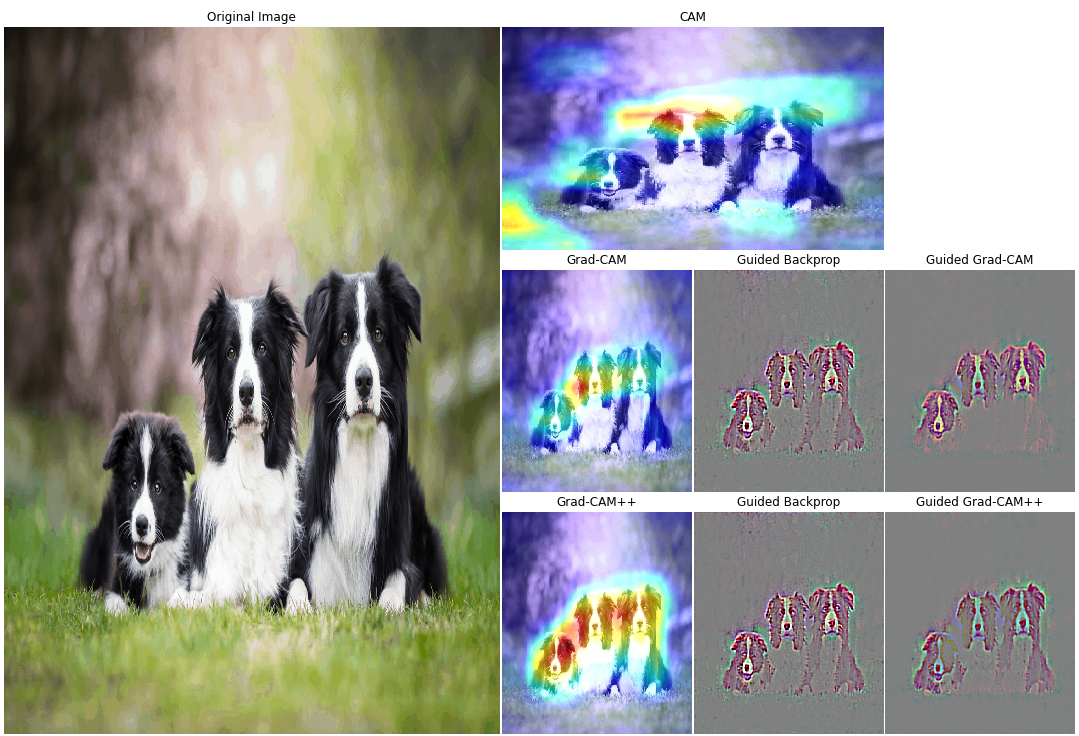
Class activation Mapping is a simple technique to get the discriminative image regions used by a CNN to identify a specific class in the image. In other words, a class activation map (CAM) lets us see which regions in the image were relevant to this class.This technique consists of producing heatmaps of “class activation” over input images. A “class activation” heatmap is a 2D grid of scores associated with a specific output class, computed for every location in an input image, indicating how important each location is with respect to the class considered. There are many implementations of this technique but here I shall be demonstrating the three most popular ones mainly CAM, Grad-CAM and Grad-CAM++.
- Deep Inside Convolutional Networks: Visualising Image Classification Models and Saliency Maps by Karen Simonyan
- Striving for Simplicity: The All Convolutional Net by Jost Tobias
- Learning Deep Features for Discriminative Localization by Bolei Zhou
- Grad-CAM: Visual Explanations from Deep Networks via Gradient-based Localization by Ramprasaath R. Selvaraju
- Grad-CAM++: Generalized Gradient-based Visual Explanations for Deep Convolutional Networks by Aditya Chattopadhyay
- Deep Learning with Python by François Chollet
- keras-grad-cam

