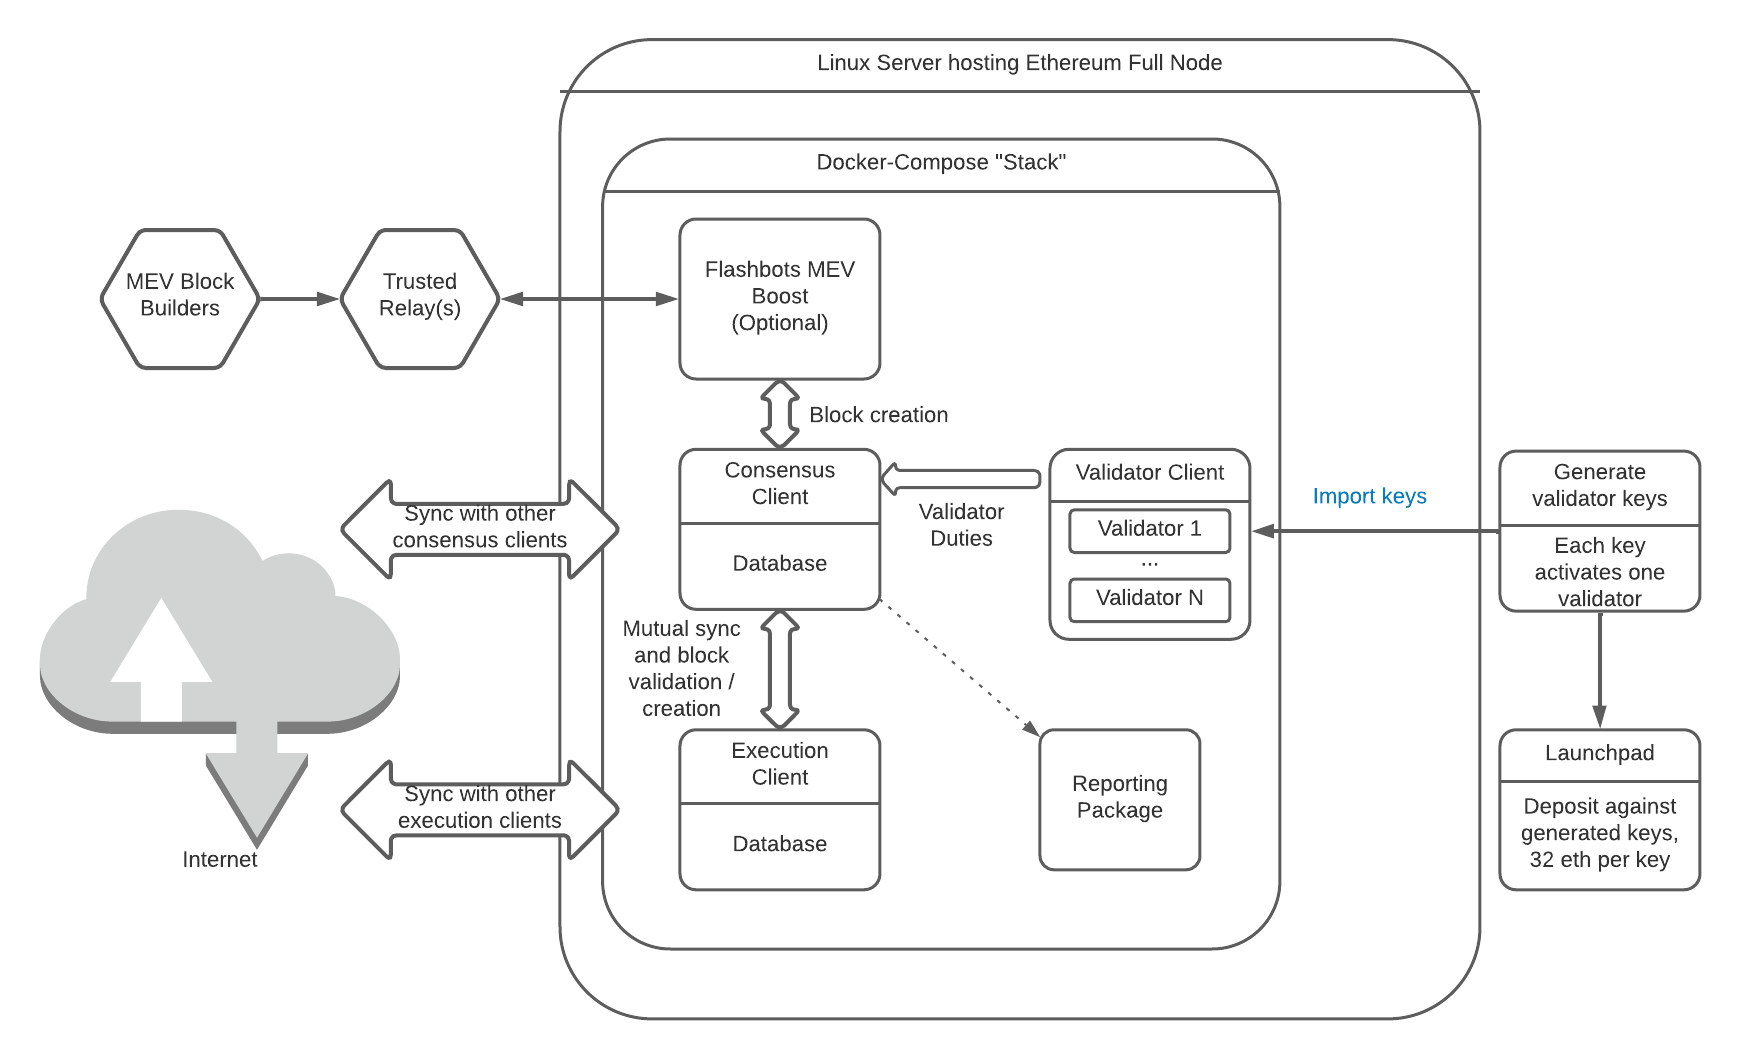
In this documentation, I will document the progress and useful commands for the homework assignment of running an eth node with the sepolia testnet.
- https://geth.ethereum.org/docs/fundamentals/peer-to-peer
- https://eth-docker.net/
- https://sepolia.beaconstate.info/
- https://docs.chain.link/chainlink-nodes/resources/run-an-ethereum-client
- https://geth.ethereum.org/
- https://github.com/ethereum/go-ethereum
- Grafana - http://54.198.244.155:3000/
- username: admin
- pwd: admin
- Total blocks (files synced) - At first, large files were synced (50 GB was not enough). But after the synchronization was completed, the overall file size decreased.
- Logs for Execution and Consensus node
- Current block height: 5488765
- Connected peers: 16
Execution client - is software that implements the Ethereum protocol and is responsible for processing transactions, executing smart contracts, and maintaining the state of the blockchain. It is responsible for the "execution layer" of the Ethereum network. The execution client is a crucial component of the Ethereum ecosystem, as it:
- Validates and propagates blocks and transactions.
- Executes the Ethereum Virtual Machine (EVM) instructions, which are the operations performed by smart contracts.
- Manages the state of the Ethereum blockchain, including accounts, balances, and contract storage.
- Handles networking with other Ethereum nodes to stay in sync with the blockchain.
Consensus client - is software that implements the consensus protocol of the Ethereum network. The consensus protocol is the set of rules that allows the nodes in the Ethereum network to agree on the state of the blockchain, ensuring its integrity and security. With the Ethereum 2.0 upgrade, the network is transitioning from a proof-of-work (PoW) to a proof-of-stake (PoS) consensus mechanism. In this new architecture, the role of the consensus client becomes even more critical, as it is responsible for:
- Block Proposal: Proposing new blocks to be added to the blockchain.
- Block Validation: Validating blocks proposed by other nodes, ensuring they follow the rules of the Ethereum protocol.
- Attestation: Attesting to the validity of blocks, which helps the network reach consensus on the canonical chain.
- Finality: Participating in the process of finalizing blocks, making them irreversible.
Validator client (Optional) - is a specific type of software that is responsible for managing a validator's operations in the proof-of-stake (PoS) consensus mechanism. Validators are participants in the network who are responsible for proposing new blocks, attesting to the validity of blocks, and helping to secure the network. To become a validator on the Ethereum 2.0 network, a participant must deposit 32 ETH into the deposit contract on the Ethereum 1.0 chain. This deposit is managed by the validator client and is used to incentivize honest participation in the network.
MEV & Flashbots (Optional) - "Miner Extractable Value" (or "Maximal Extractable Value" in the broader sense). It refers to the additional value that miners (or validators in a proof-of-stake system) can extract from their ability to include, exclude, or reorder transactions within the blocks they produce.
In the beginning I tried to install it using go-ethereum (geth) - https://github.com/ethereum/go-ethereum
docker run -d --name ethereum-node -v $pwd:/root -p 8545:8545 -p 30303:30303 ethereum/client-go
It installed, but only the geth command line function worked since we intended to create a full node and configure the monitoring dashboard.
Then I found eth-docker, a fairly stable and unified tool that allows you to set up full nodes without any hassle - https://eth-docker.net/Usage/QuickStart
Following commands will setup the nodes.
Before this, I created a VPS on AWS.
- 2 vcpu, 2 GB RAM
- 15 GB SSD disk. It froze during installation because the docker images and accompanying software totaled more than 15GB.
Then I created a VPS with 50 GB of disks and 8 GB of RAM. The installation was successful, but suddenly Grafana Dashboard and the node stopped synchronizing. I'm troubleshooting all the services, but the services are working correctly. I found that the disk is full because the node is synchronizing all blocks (Genesis) and the total size is over 50GB.
In the final, I created a machine with 2TB drives and it synced and worked perfectly.
Command set:
- Ubuntu 22
- Download Eth Docker
cd ~ && git clone https://github.com/eth-educators/eth-docker.git && cd eth-docker
- Install pre-requisites such as Docker. This will pull docker images also.
./ethd install
- Configure Eth Docker with
.envfile- In this Git repository
- Set sepolia network
- testnet address
https://sepolia.beaconstate.info - Set reward address
- Add external tools added this in the config file.
COMPOSE_FILE=prysm.yml:geth.yml:grafana.yml:grafana-shared.yml:mev-boost.yml - Consensus node =
Prysm- Other options were:
- Lodestar
- Nimbus
- Teku
- Lighthouse
- Prysm
- Execution node =
Geth- Nethermind
- Besu
- Geth
- Reth (beta)
- Erigon
- Added every possible configs that was in the documentation to check its functionalities.
- Start Eth Docker
./ethd up- This command will setup and start all docker containers that was defined in the
.envconfig file.
- All available services
docker ps -a
- Grafana metrics
Check the node is syncing
time="2024-03-14 14:57:12" level=info msg="Synced new block" block=0xd67510ef... epoch=142433 finalizedEpoch=142431 finalizedRoot=0xbf48480d... prefix=blockchain slot=4557886
docker exec -it 81 /bin/sh
geth attach http://localhost:8545
To enter to CLI mode of Geth.
eth command to check available functions and basic informations
To check:
- Current block height
curl -X POST -H "Content-Type: application/json" --data '{"jsonrpc":"2.0","method":"eth_blockNumber","params":[],"id":1}' http://localhost:8545- Result:
{"jsonrpc":"2.0","id":1,"result":"0x53c23d"}->5489213dec
- Connected peer count
curl -X POST -H "Content-Type: application/json" --data '{"jsonrpc":"2.0","method":"net_peerCount","params":[],"id":1}' http://localhost:8545- Result: {"jsonrpc":"2.0","id":1,"result":"0x10"} ->
16dec
Write a simple script (in your language of choice) that periodically checks the node's status and logs basic information (e.g., current block height, number of peers connected).
I prepared a python code script to periodically check the status of those basic informations - script.py
There should more simple solutions such as AWS lambda or Adding a widget on Grafana.
Also we can setup slack channel to get notified when anything goes wrong


