The complete project of Self-Driving Car Engineer Nanodegree Program. I done the assignment at winter, 2018. I just upload this in to github.
You can download the variable data via here.
Build a Traffic Sign Recognition Project
The goals / steps of this project are the following:
- Load the data set (see below for links to the project data set)
- Explore, summarize and visualize the data set
- Design, train and test a model architecture
- Use the model to make predictions on new images
- Analyze the softmax probabilities of the new images
- Summarize the results with a written report
1. Provide a basic summary of the data set. In the code, the analysis should be done using python, numpy and/or pandas methods rather than hardcoding results manually.
I used the pandas library to calculate summary statistics of the traffic signs data set:
- The size of training set is 34799.
- The size of the validation set is 4410.
- The size of test set is 12630.
- The shape of a traffic sign image is (32, 32, 3).
- The number of unique classes/labels in the data set is 43.
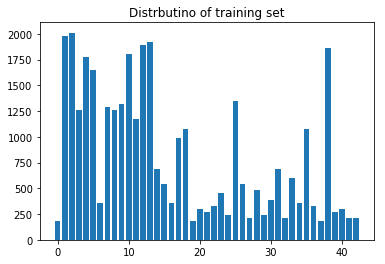
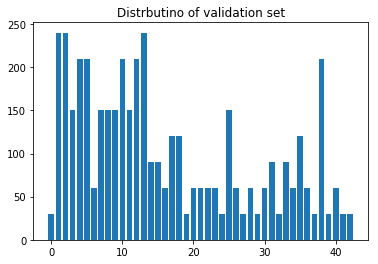
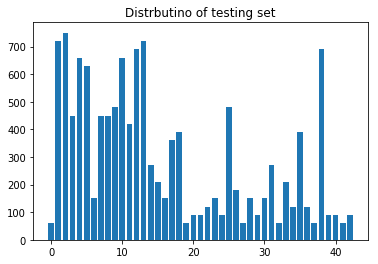
Here is an exploratory visualization of the data set. It is a bar chart showing the data distubution of training set, validation set, and testing set, respectively.
1. Describe how you preprocessed the image data. What techniques were chosen and why did you choose these techniques? Consider including images showing the output of each preprocessing technique. Pre-processing refers to techniques such as converting to grayscale, normalization, etc. (OPTIONAL: As described in the "Stand Out Suggestions" part of the rubric, if you generated additional data for training, describe why you decided to generate additional data, how you generated the data, and provide example images of the additional data. Then describe the characteristics of the augmented training set like number of images in the set, number of images for each class, etc.)
In here, I normlize all of the image of dataset from (0 ~ 255) into (-1 ~ 1). However, I didn't convert the images to grayscale because I feel the color image are robuster than gray image when we train the model, meanwhile, it can reserve more detail of images.
- The code of normlize function is titled by "Pre-process the Data Set" in ipython notebook.
2. Describe what your final model architecture looks like including model type, layers, layer sizes, connectivity, etc.) Consider including a diagram and/or table describing the final model.
My final model consisted of the following layers:
| Layer | Description |
|---|---|
| Input | 32x32x3 RGB image |
| Convolution 3x3 | 1x1 stride, same padding, outputs 32x32x32 |
| RELU | |
| Max pooling | 2x2 stride, outputs 16x16x32 |
| Convolution 3x3 | 1x1 stride, same padding, outputs 16x16x64 |
| RELU | |
| Max pooling | 2x2 stride, outputs 8x8x64 |
| Convolution 3x3 | 1x1 stride, same padding, outputs 8x8x128 |
| RELU | |
| Convolution 1x1 | 1x1 stride, same padding, outputs 8x8x64 |
| RELU | |
| Fully connected | outputs 1024 |
| Fully connected | outputs 43 |
| Softmax |
- The code of model architecture is titled by "Model Architecture" in ipython notebook.
3. Describe how you trained your model. The discussion can include the type of optimizer, the batch size, number of epochs and any hyperparameters such as learning rate.
To train the model, I used a cross entropy as loss function, and using Adam to optimze the model.
- The code of loss function and optimizer are in the first cell of title "Train, Validate and Test the Model" in ipython notebook.
The training hyperparameters is:
| hyperparameters | |
|---|---|
| Epoch | 20 |
| Batch size | 128 |
| Learning rate | 0.001 |
- The code of hyperparameters is titled by "Hyperparameter" in ipython notebook.
4. Describe the approach taken for finding a solution and getting the validation set accuracy to be at least 0.93. Include in the discussion the results on the training, validation and test sets and where in the code these were calculated. Your approach may have been an iterative process, in which case, outline the steps you took to get to the final solution and why you chose those steps. Perhaps your solution involved an already well known implementation or architecture. In this case, discuss why you think the architecture is suitable for the current problem.
My final model results were:
-
training set accuracy of 1.000
-
validation set accuracy of 0.948
-
test set accuracy of 0.940
-
The code of training process is in the second and third cell of title "Train, Validate and Test the Model" in ipython notebook.
If an iterative approach was chosen:
-
What was the first architecture that was tried and why was it chosen? The first architecture I try it was this architecture and it gat the good performs. I this architecture, I just using 3-by-3 ConvNet because of the data set is more complex than mnist dataset, and I using three 3-by-3 ConvNet to extraxt features and using one 1-by-1 ConvNet to reduce feature dimension, than using fully-connected layer to classfy. In here I change some problems.
-
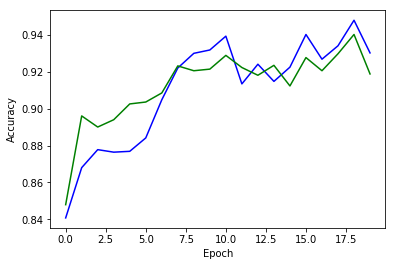
What was the problem I meet? In when I training the model in first time, I just save the model in last epoch, but I found some problem of this because it might not the best result of this model. So I modify the code and save the best result of ny model, meanwhile save the result of validation set and testing set in every epoch, than got the result was shown on below. According to this figure, I find the model converge quickly, than the performance was down, it might leave from local minmize than search another minmize. Finally, it get the best preformance on the 19th epoch.
1. Choose five German traffic signs found on the web and provide them in the report. For each image, discuss what quality or qualities might be difficult to classify.
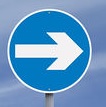
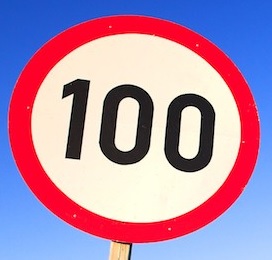
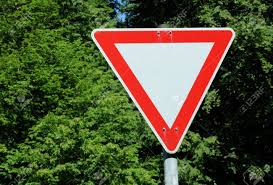
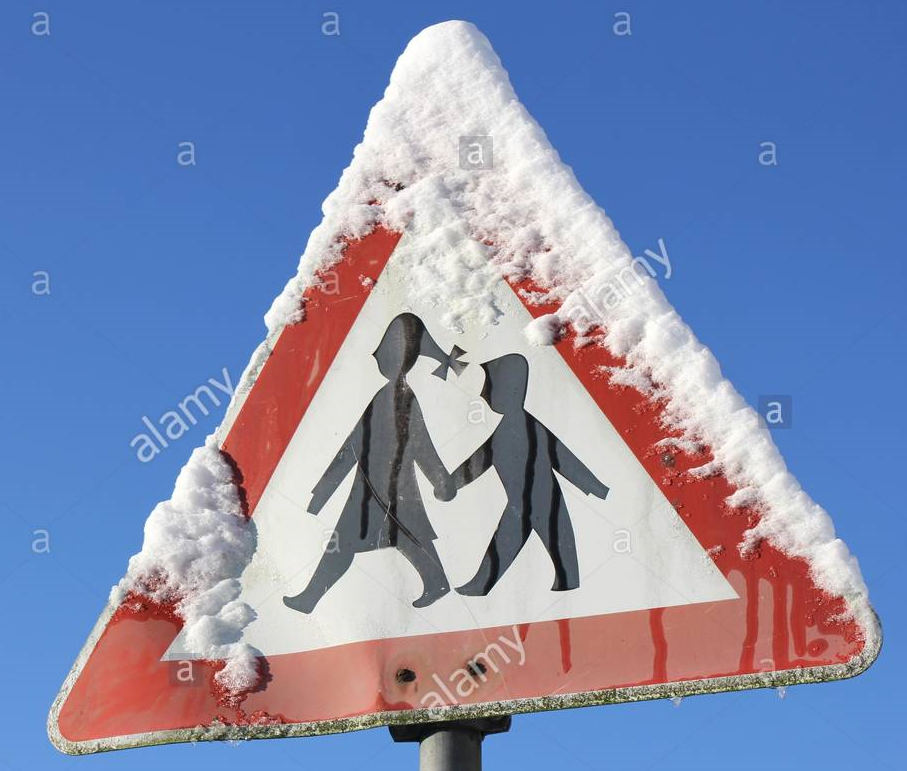
Here are five German traffic signs that I found on the web:
The fiveth image might be difficult to classify because it have some snow cover on it, and the others are easy to classify because it look very clear.
2. Discuss the model's predictions on these new traffic signs and compare the results to predicting on the test set. At a minimum, discuss what the predictions were, the accuracy on these new predictions, and compare the accuracy to the accuracy on the test set (OPTIONAL: Discuss the results in more detail as described in the "Stand Out Suggestions" part of the rubric).
Here are the results of the prediction:
| Image | Prediction |
|---|---|
| Keep right | Keep right |
| Speed limit (50km/h) | Speed limit (30km/h) |
| Speed limit (100km/h) | Pedestrians |
| Yield | Yield |
| Children crossing | Right-of-way at the next intersection |
The model was only can correctly guess 1 of the 5 traffic signs, which gives an accuracy of 40%.
- The code of this part is titled by "Predict the Sign Type for Each Image" and "Analyze Performance" in ipython notebook.
3. Describe how certain the model is when predicting on each of the five new images by looking at the softmax probabilities for each prediction. Provide the top 5 softmax probabilities for each image along with the sign type of each probability. (OPTIONAL: as described in the "Stand Out Suggestions" part of the rubric, visualizations can also be provided such as bar charts)
For the first image, the model is correct. The top five soft max probabilities were
- Real Sample 1, correct label is Keep right 0.999586% Keep right 0.000414% Turn left ahead 0.000000% Yield 0.000000% Turn right ahead 0.000000% Road work
For the second image, the model can't classfy it. The top five soft max probabilities were
- Real Sample 2, correct label is Speed limit (50km/h) 1.000000% Speed limit (30km/h) 0.000000% Speed limit (50km/h) 0.000000% Ahead only 0.000000% Wild animals crossing 0.000000% Speed limit (60km/h)
For the trird image, the model can't classfy it. The top five soft max probabilities were
- Real Sample 3, correct label is Speed limit (100km/h) 0.646655% Pedestrians 0.272376% Speed limit (50km/h) 0.078680% Right-of-way at the next intersection 0.001377% Double curve 0.000310% End of speed limit (80km/h)
For the fourth image, the model is correct. The top five soft max probabilities were
- Real Sample 4, correct label is Yield 0.992095% Yield 0.007849% No passing for vehicles over 3.5 metric tons 0.000057% Priority road 0.000000% Stop 0.000000% Road work
For the fiveth image, the model can't classfy it. The top five soft max probabilities were
- Real Sample 5, correct label is Children crossing 0.999943% Right-of-way at the next intersection 0.000054% Children crossing 0.000002% Priority road 0.000000% Stop 0.000000% Bicycles crossing
For the result of above, I think the model can't work well on the real scene, it might have some problem I think which was listed on below.
- the lack of some data in the dataset
- Unequal of data
- the different of domain between training data and real data.
