
Dashing is a library to quickly create terminal-based dashboards in Python.
Similar libraries for other languages: termui blessed blessed-contrib
Features: - [x] Sub-character resolution (partially filled blocks) - [x] Horizontal and vertical bars with gradient coloring - [x] Text and log panes with automated scrolling - [x] Automatic scaling of all elements - [x] Vertical and horizontal tile splitting - [x] Braille-filled charts - [x] Theming with 24-bit RGB and HSV colors - [x] Color gradients
The blessed library.
See the documentation at https://dashing.readthedocs.io/en/latest/
Usage
import math
from time import time, sleep
from dashing import (
ColorRangeVGauge,
HBrailleChart,
HChart,
HGauge,
HSplit,
Log,
Text,
VChart,
VGauge,
VSplit,
)
if __name__ == '__main__':
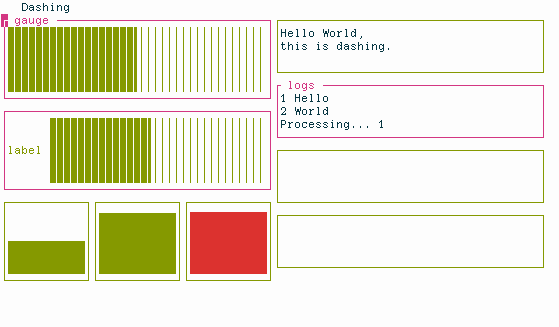
ui = HSplit(
VSplit(
HGauge(val=50, title="only title", border_color=5),
HGauge(label="only label", val=20, border_color=5),
HGauge(label="only label", val=30, border_color=5),
HGauge(label="only label", val=50, border_color=5),
HGauge(label="only label", val=80, border_color=5),
HGauge(val=20),
HGauge(label="label, no border", val=55),
HSplit(
VGauge(val=0, border_color=2),
VGauge(val=5, border_color=2),
VGauge(val=30, border_color=2),
VGauge(val=50, border_color=2),
VGauge(val=80, border_color=2, color=4),
VGauge(val=95, border_color=2, color=3),
ColorRangeVGauge(
val=100,
border_color=2,
colormap=(
(33, 2),
(66, 3),
(100, 1),
)
),
)
),
VSplit(
Text('Hello World,\nthis is dashing.', border_color=2),
Log(title='logs', border_color=5),
VChart(border_color=2, color=2),
HChart(border_color=2, color=2),
HBrailleChart(border_color=2, color=2),
# HBrailleFilledChart(border_color=2, color=2),
),
title='Dashing',
)
log = ui.items[1].items[1]
vchart = ui.items[1].items[2]
hchart = ui.items[1].items[3]
bchart = ui.items[1].items[4]
# bfchart = ui.items[1].items[5]
log.append("0 -----")
log.append("1 Hello")
log.append("2 -----")
prev_time = time()
with open_terminal() as terminal:
for cycle in range(0, 200):
ui.items[0].items[0].value = int(50 + 49.9 * math.sin(cycle / 80.0))
ui.items[0].items[1].value = int(50 + 45 * math.sin(cycle / 20.0))
ui.items[0].items[2].value = int(50 + 45 * math.sin(cycle / 30.0 + 3))
vgauges = ui.items[0].items[-1].items
for gaugenum, vg in enumerate(vgauges):
vg.value = 50 + 49.9 * math.sin(cycle / 12.0 + gaugenum)
t = int(time())
if t != prev_time:
log.append("%s" % t)
prev_time = t
vchart.append(50 + 50 * math.sin(cycle / 16.0))
hchart.append(99.9 * abs(math.sin(cycle / 26.0)))
bchart.append(50 + 50 * math.sin(cycle / 6.0))
# bfchart.append(50 + 50 * math.sin(cycle / 16.0))
ui.display(terminal)
sleep(1.0 / 25)