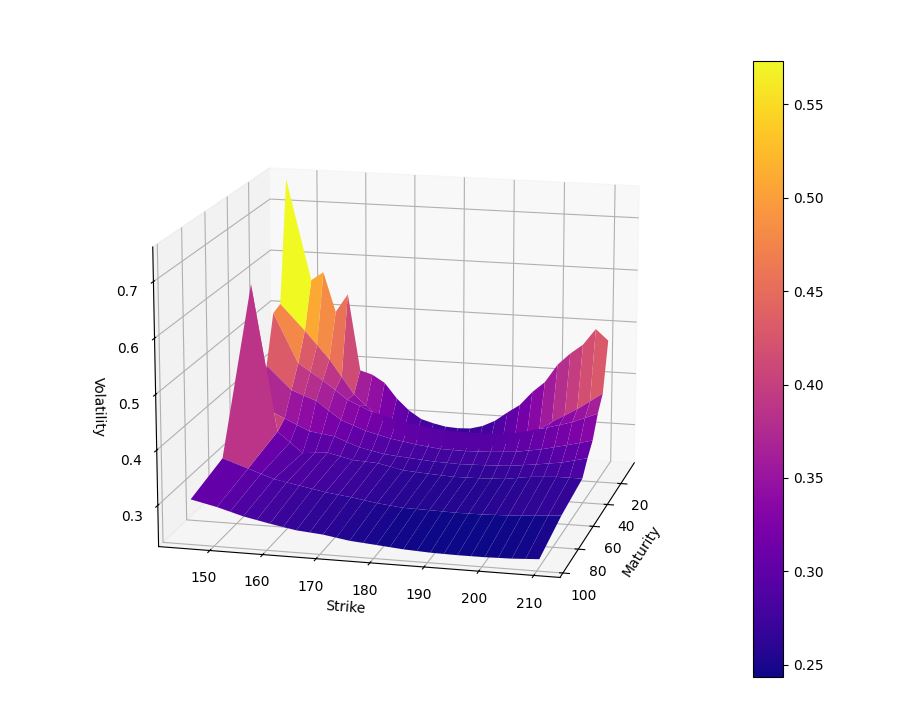
This Python script generates a volatility surface for a given underlying asset using option prices retrieved from Yahoo Finance. It employs the Black-Scholes-Merton (BSM) model for implied volatility calculation.
- Python 3.x
- yfinance
- pandas
- numpy
- scipy
- matplotlib
- tkinter
-
Clone the repository:
git clone https://github.com/Gologoye/volatility-surface-yfinance.git
-
Install the required dependencies:
pip install -r requirements.txt
-
Run the script:
python volatility_surface.py
-
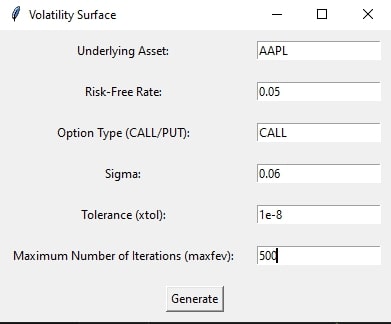
Enter the required parameters in the GUI window:
- Underlying Asset: Enter the ticker symbol of the underlying asset, to find the right ticker, look on finance.yahoo.com..
- Risk-Free Rate: Enter the risk-free rate (decimal).
- Option Type (CALL/PUT): Enter the type of option to analyze (CALL or PUT).
- Sigma: Enter the initial guess for volatility (decimal).
- Tolerance (xtol): Enter the tolerance for the solver.
- Maximum Number of Iterations (maxfev): Enter the maximum number of iterations for the solver.
-
Click the "Generate" button to generate the volatility surface plot.
- The script retrieves historical stock data and option chain data from Yahoo Finance.
- It filters option contracts based on strike price proximity to the current stock price.
- The BSM model is used to calculate implied volatility.
- The GUI is implemented using Tkinter.

