


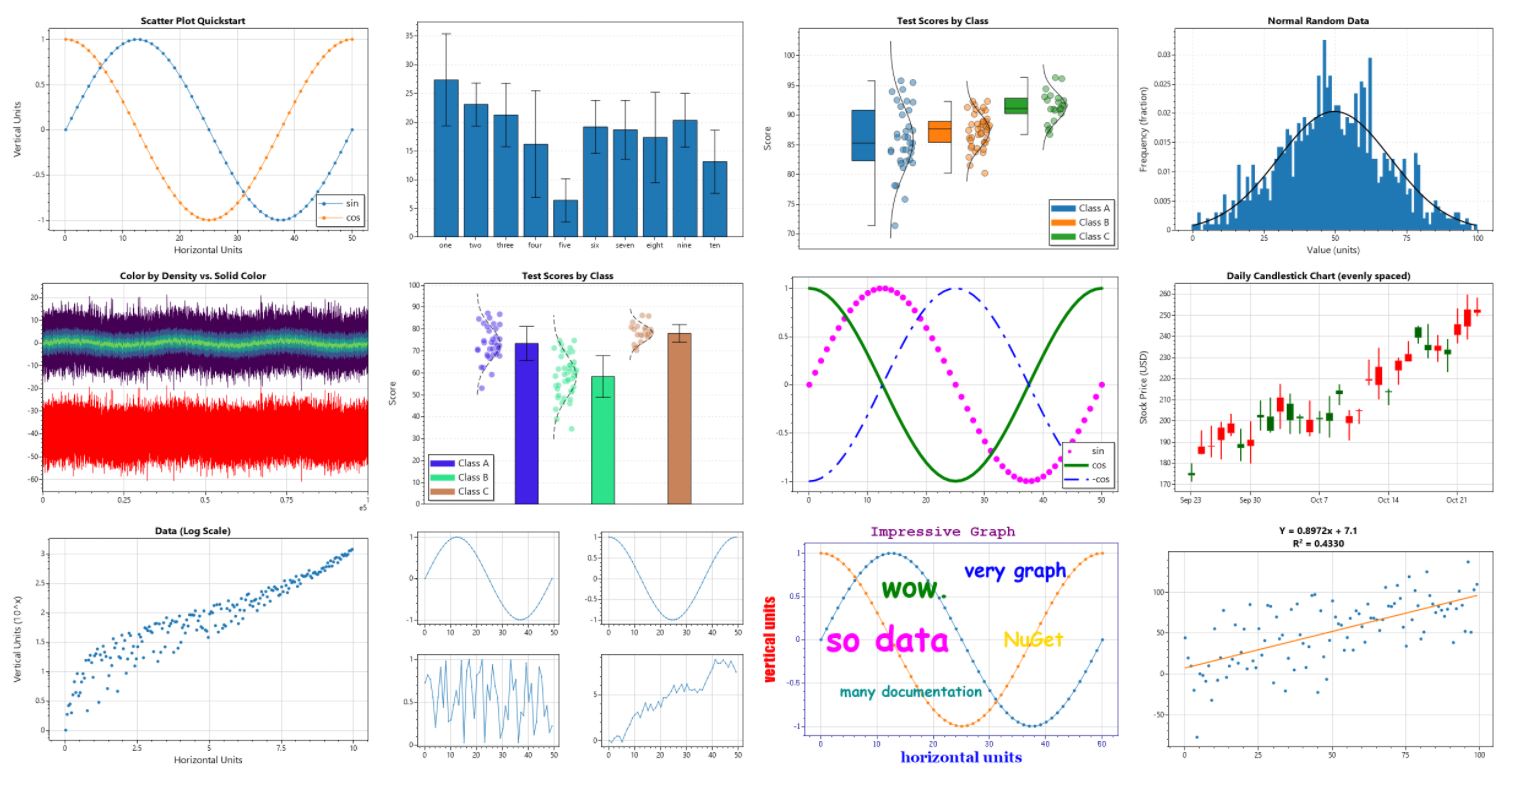
ScottPlot is a free and open-source plotting library for .NET that makes it easy to interactively display large datasets. The ScottPlot Cookbook demonstrates how to create line plots, bar charts, pie graphs, scatter plots, and more with just a few lines of code.
-
ScottPlot Cookbook 👈 Learn how to use ScottPlot
-
ScottPlot Demo 👈 See what ScottPlot can do
-
Ask questions in Discussions, Issues, or on StackOverflow
-
Create an issue for a feature suggestion or bug report
-
If you enjoy ScottPlot give us a star! ⭐
Windows Forms: Use NuGet to install ScottPlot.WinForms, drag/drop a FormsPlot onto your form, then add the following to your start-up sequence:
double[] xs = new double[] {1, 2, 3, 4, 5};
double[] ys = new double[] {1, 4, 9, 16, 25};
formsPlot1.Plot.AddScatter(xs, ys);
More Quickstarts:
This figure is an example of ScottPlot running in the cloud. Every hour an Azure Function hits the GitHub API to get an updated list of stargazers, then uses ScottPlot to create a figure from this data and saves it to web-accessible blob storage. Since this automatically-generated plot is just a static image accessible by a URL, it can be displayed in places where JavaScript is not permitted (like in this readme file). Creating plots as images on a server allows dynamic plots to be displayed in many interesting places!
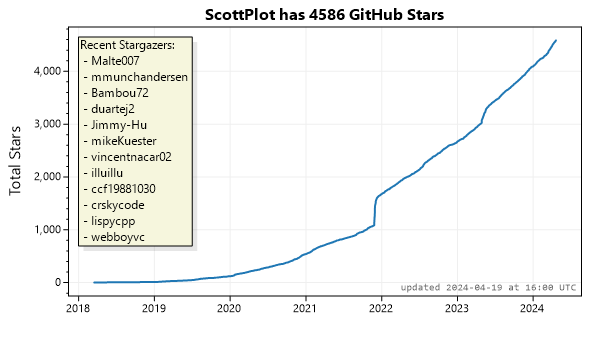
Try it out! Give us a star and come back in an hour and your name will appear here
-
Minimum Supported Platforms: .NET Core 2.0 and .NET Framework 4.6.1 (see details)
-
Active development is focused on topics listed in the pinned Triaged Tasks and Features issues.
-
Contributions are welcome! See contributing.md to get started
ScottPlot was created by Scott W Harden (with many contributions from the open-source community) and is provided under the permissive MIT license.