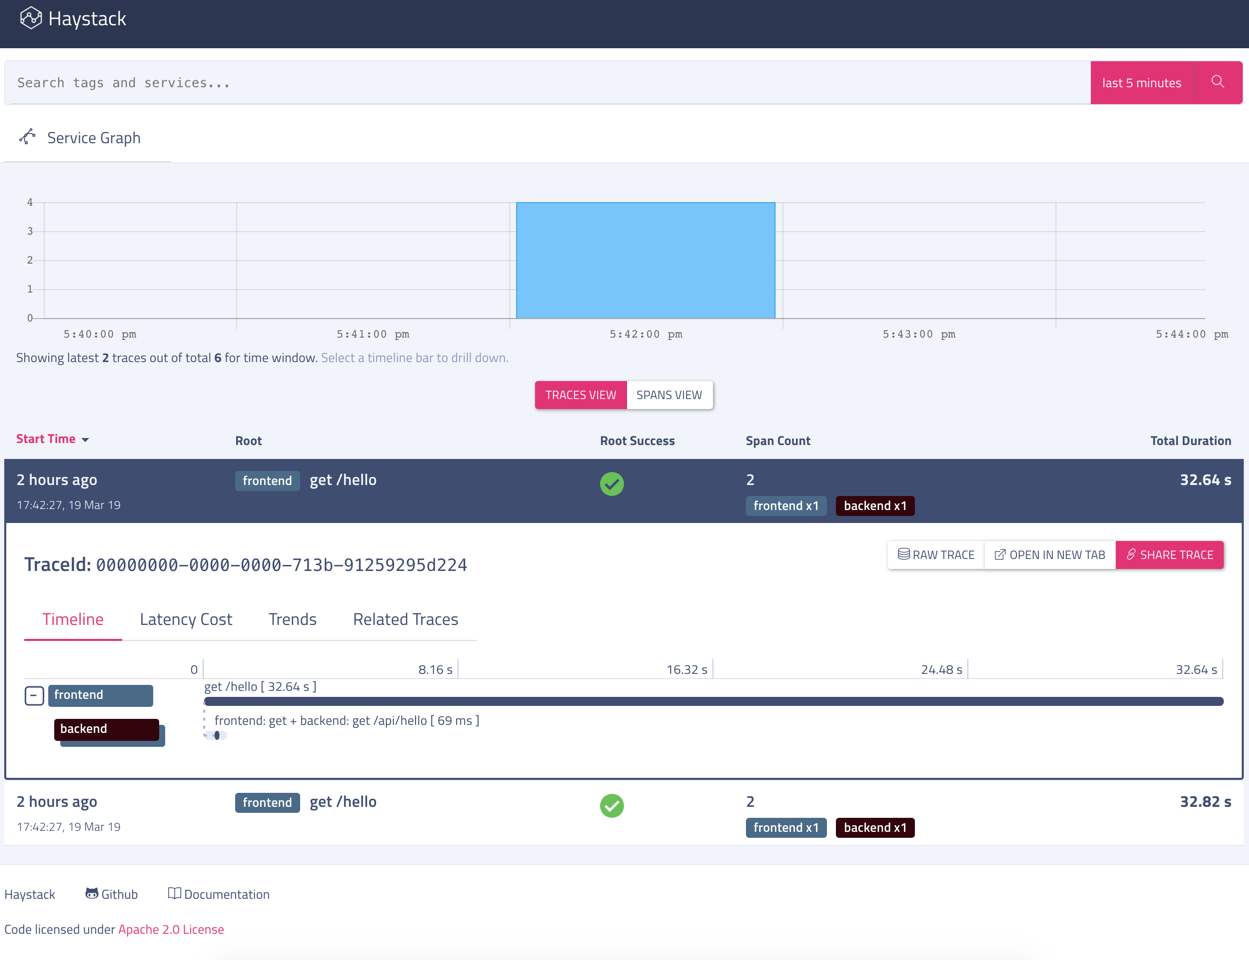
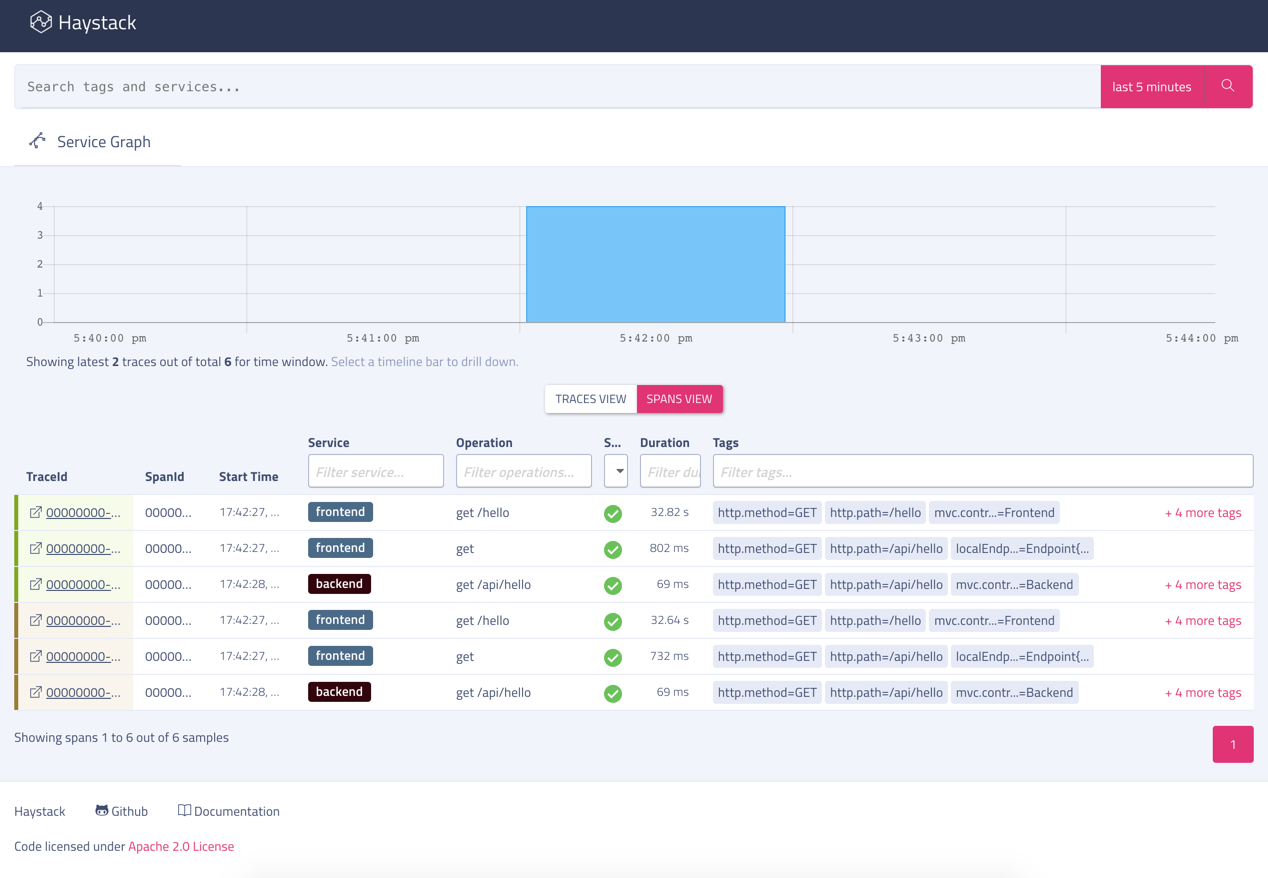
In this example, the two Spring Sleuth services call one from another to show a client and server working with tracing instrumentation. Telemetry from this application is recorded in Haystack server, a distributed tracing system. Haystack will allow one to see the service call dependency and how long it took for the whole operation to complete. Here is what a sample output in the UI will look like:
This is a very basic example that can output the instrumentation to console and/or a Haystack server. This is an example application written with two simple Spring Services to show how a Spring application can be instrumented with spring-cloud-sleuth-haystack-reporter and Spring Cloud Sleuth.
-
Frontend service: This listens on port 9090 and exposes one endpoint: http://localhost:9090/hello - this in turn calls the endpoint exposed by
Backendand proxy the response -
Backend service: This listens on port 9091 and exposes one endpoint : http://localhost:9091/api - when invoked, it returns a simple string like
Hello, It's Tue Mar 19 21:46:29 IST 2019
If one peeks into the code, both Frontend.java and Backend.java are simple Spring boot applications with no additional instrumentation code other than @Autowired Tracer used just for logging purpose. All of the required wirings are done using Spring sleuth using the config provided in application.yml.
The Haystack reporter and Spring Sleuth are automatically configured. Though there is one thing to take care of, that is if we need to trace all our requests we should create a Sampler bean as shown below
@Bean
Sampler sampler() {
   return Sampler.ALWAYS_SAMPLE;
}
Required:
- Java 1.8
Build:
./mvnw clean compileWe need a haystack server to run this example so that traces are reported to haystack.
To start haystack and agent locally, one can follow the instructions at https://github.com/ExpediaDotCom/haystack-docker#to-start-haystacks-traces-trends-and-service-graph
After starting Haystack server, run this example with the following commands. This starts the application with the configuration in frontend_remote.yml and backend_remote.yml
./mvnw exec:java -Dexec.args="frontend"
./mvnw exec:java -Dexec.args="backend"
and send a sample request
curl http://localhost:9090/helloAnd then open Haystack UI at http://localhost:8080/ and search for serviceName=frontend to see the traces. (see screenshot above)
One can also use the sample script we have to send more requests to the sample application.
./run.shScreenshot of the spans view.


