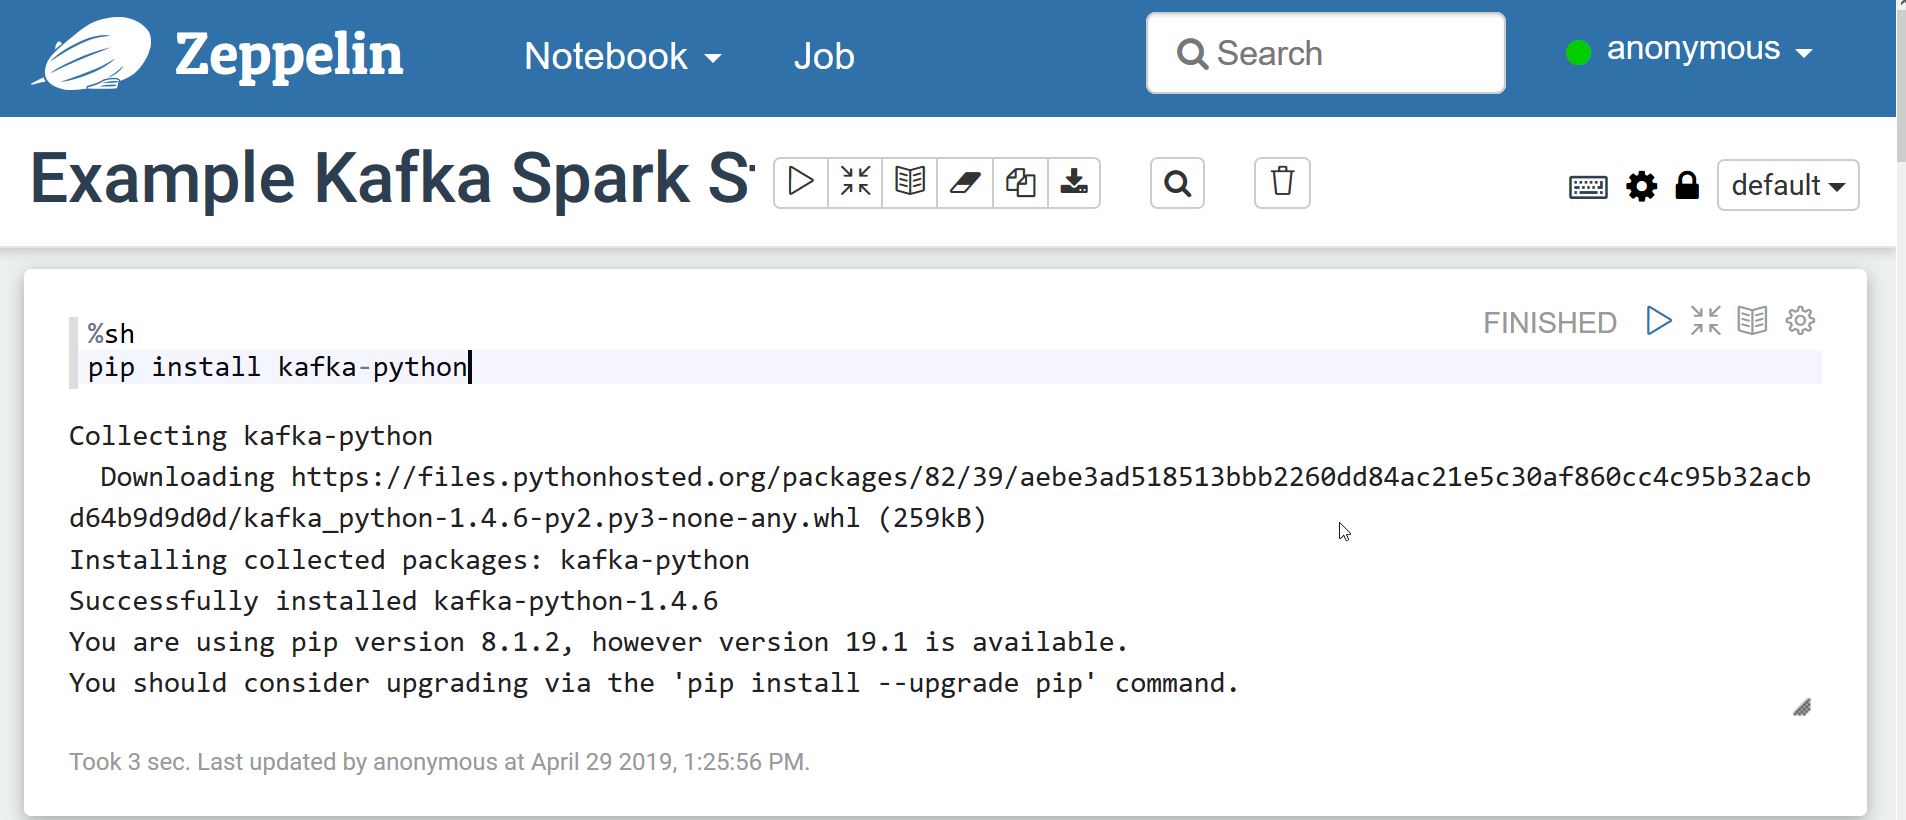
This repository contains a docker-compose stack with Kafka and Spark Streaming, together with monitoring with Kafka Manager and a Grafana Dashboard. The networking is set up so Kafka brokers can be accessed from the host.
It also comes with a producer-consumer example using a small subset of the US Census adult income prediction dataset.
|
|
|
|
| Container | Image | Tag | Accessible |
|---|---|---|---|
| zookeeper | wurstmeister/zookeeper | latest | 172.25.0.11:2181 |
| kafka1 | wurstmeister/kafka | 2.12-2.2.0 | 172.25.0.12:9092 (port 8080 for JMX metrics) |
| kafka1 | wurstmeister/kafka | 2.12-2.2.0 | 172.25.0.13:9092 (port 8080 for JMX metrics) |
| kafka_manager | hlebalbau/kafka_manager | 1.3.3.18 | 172.25.0.14:9000 |
| prometheus | prom/prometheus | v2.8.1 | 172.25.0.15:9090 |
| grafana | grafana/grafana | 6.1.1 | 172.25.0.16:3000 |
| zeppelin | apache/zeppelin | 0.8.1 | 172.25.0.19:8080 |
The easiest way to understand the setup is by diving into it and interacting with it.
To run docker compose simply run the following command in the current folder:
docker-compose up -d
This will run deattached. If you want to see the logs, you can run:
docker-compose logs -f -t --tail=10
To see the memory and CPU usage (which comes in handy to ensure docker has enough memory) use:
docker stats
You can access the default notebook by going to http://172.25.0.19:8080/#/notebook/2EAB941ZD. Now we can start running the cells.
We have an interpreter called %producer.pyspark that we'll be able to run in parallel.
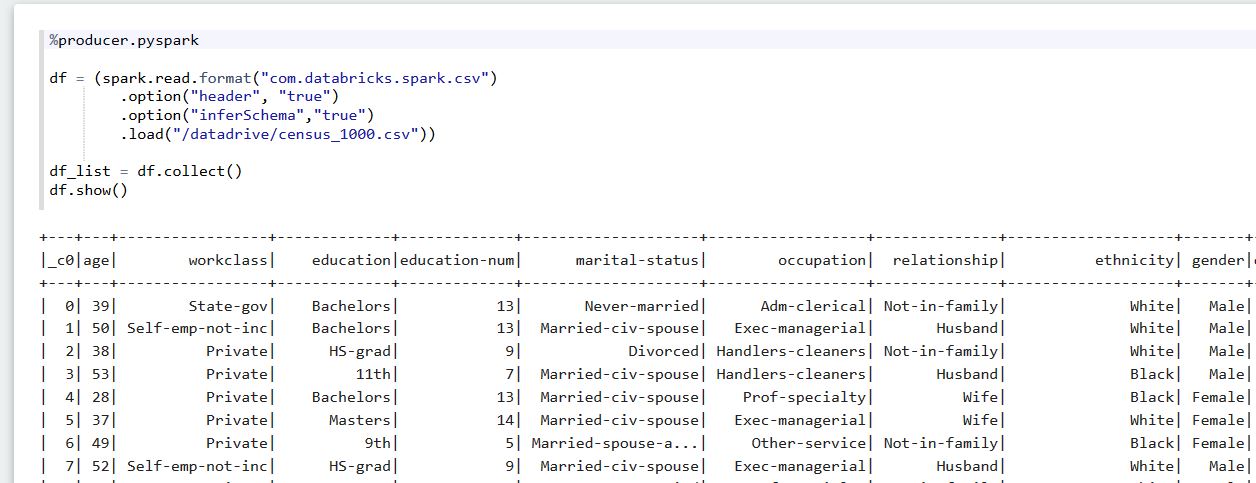
We have made available a 1000-row version of the US Census adult income prediction dataset.
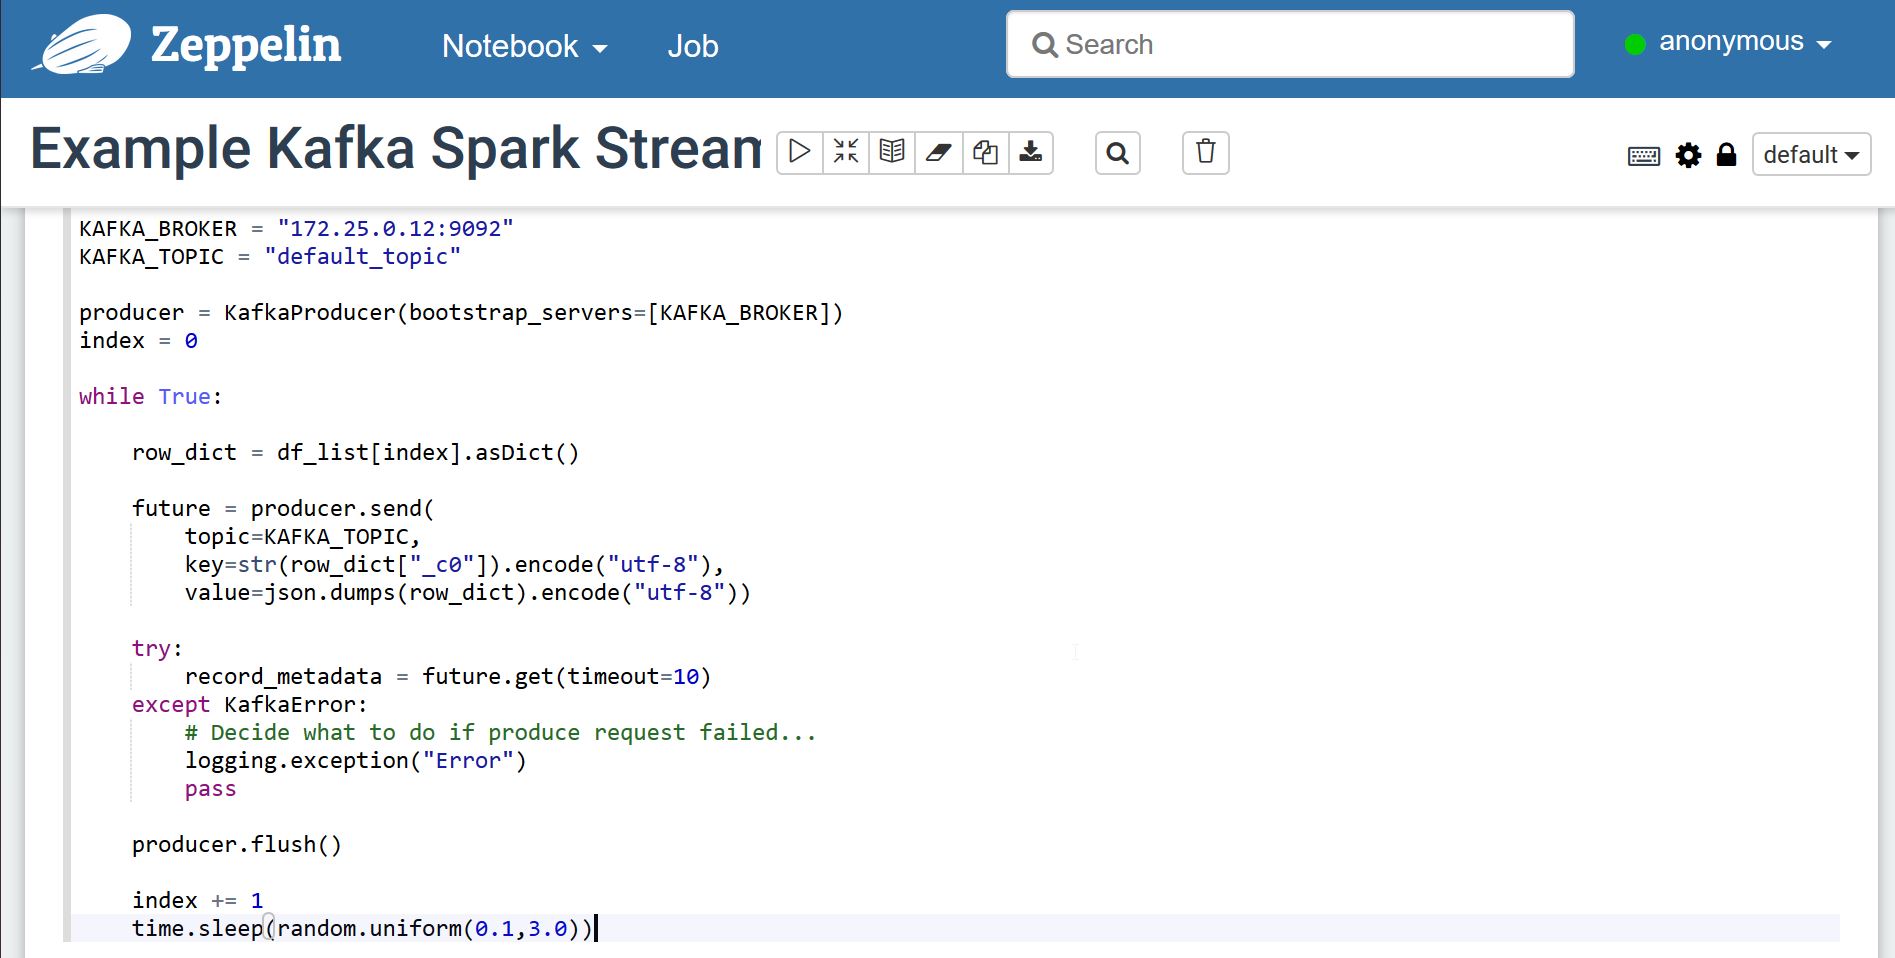
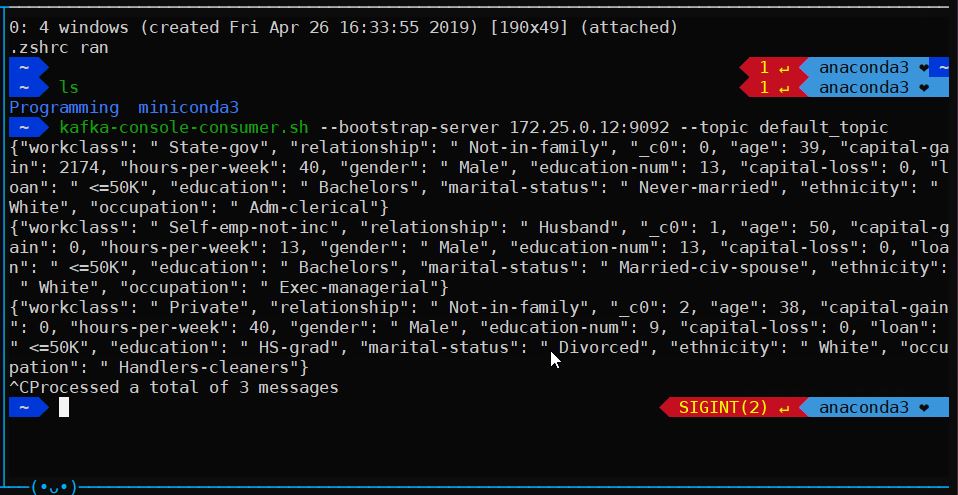
We now take one row at random, and send it using our python-kafka producer. The topic will be created automatically if it doesn't exist (given that auto.create.topics.enable is set to true).
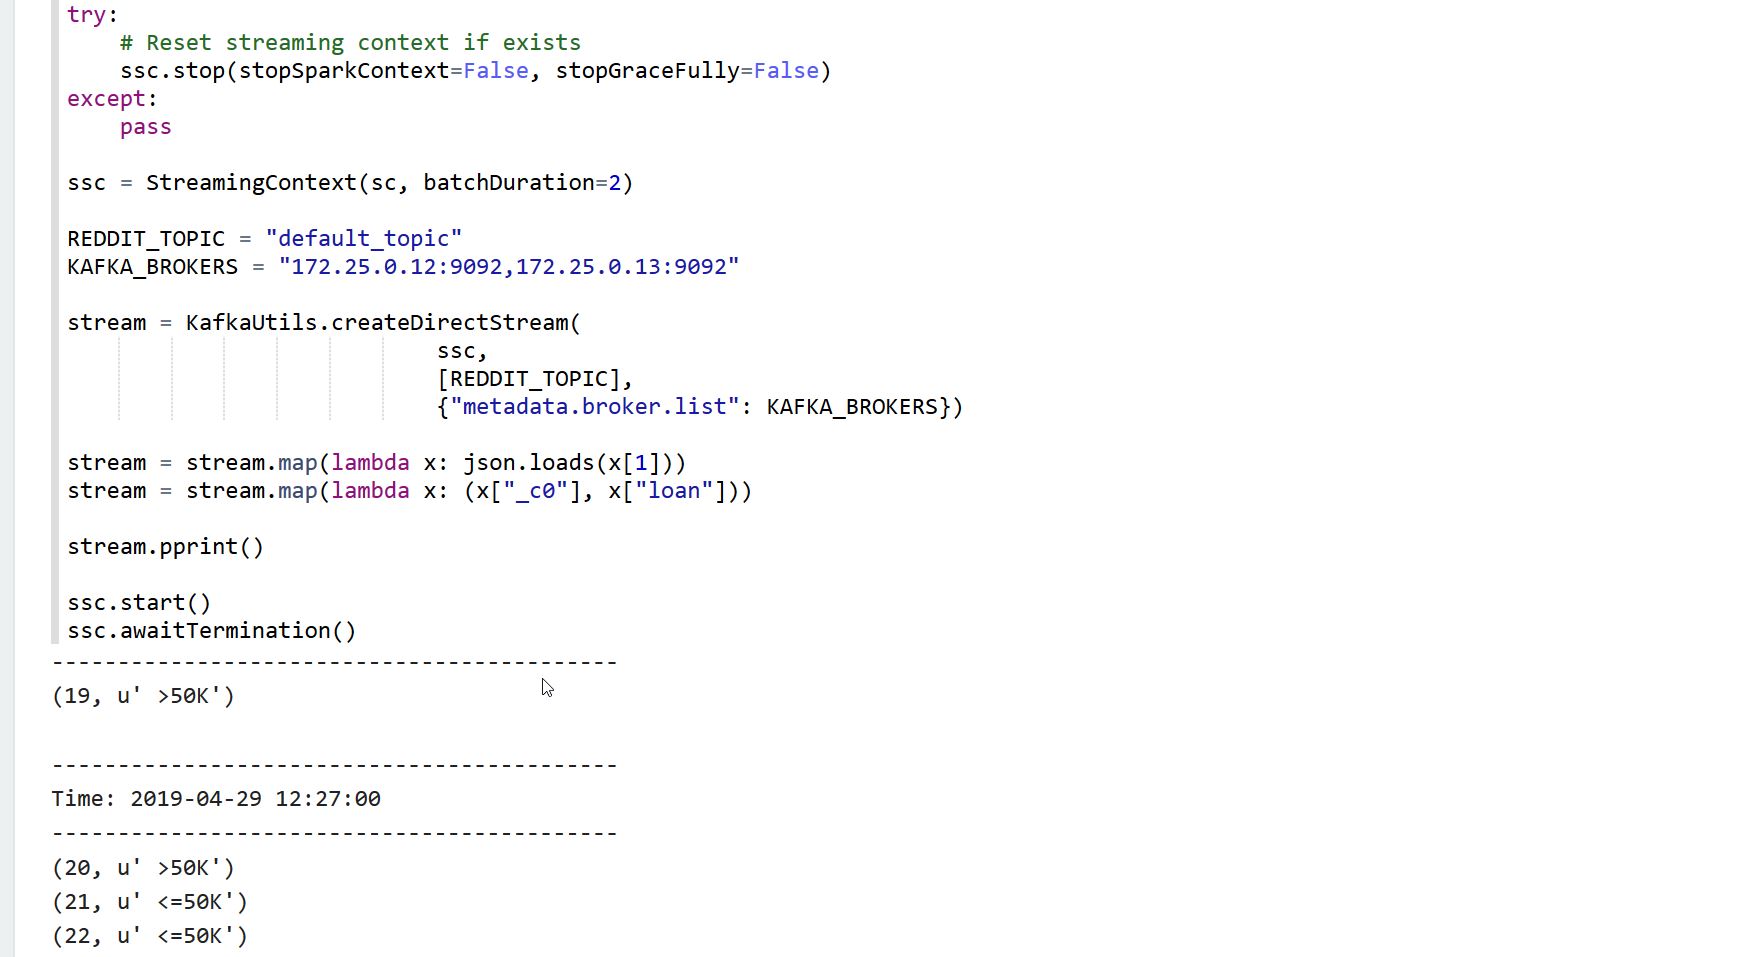
We now use the %consumer.pyspark interpreter to run our pyspark job in parallel to the producer.
Now we can run the spark stream job to connect to the topic and listen to data. The job will listen for windows of 2 seconds and will print the ID and "label" for all the rows within that window.
We can now use the kafka manager to dive into the current kafka setup.
To set up kafka manager we need to configure it. In order to do this, access http://172.25.0.14:9000/addCluster and fill up the following two fields:
- Cluster name: Kafka
- Zookeeper hosts: 172.25.0.11:2181
Optionally:
- You can tick the following;
- Enable JMX Polling
- Poll consumer information
If your cluster was named "Kafka", then you can go to http://172.25.0.14:9000/clusters/Kafka/topics/default_topic, where you will be able to see the partition offsets. Given that the topic was created automatically, it will have only 1 partition.
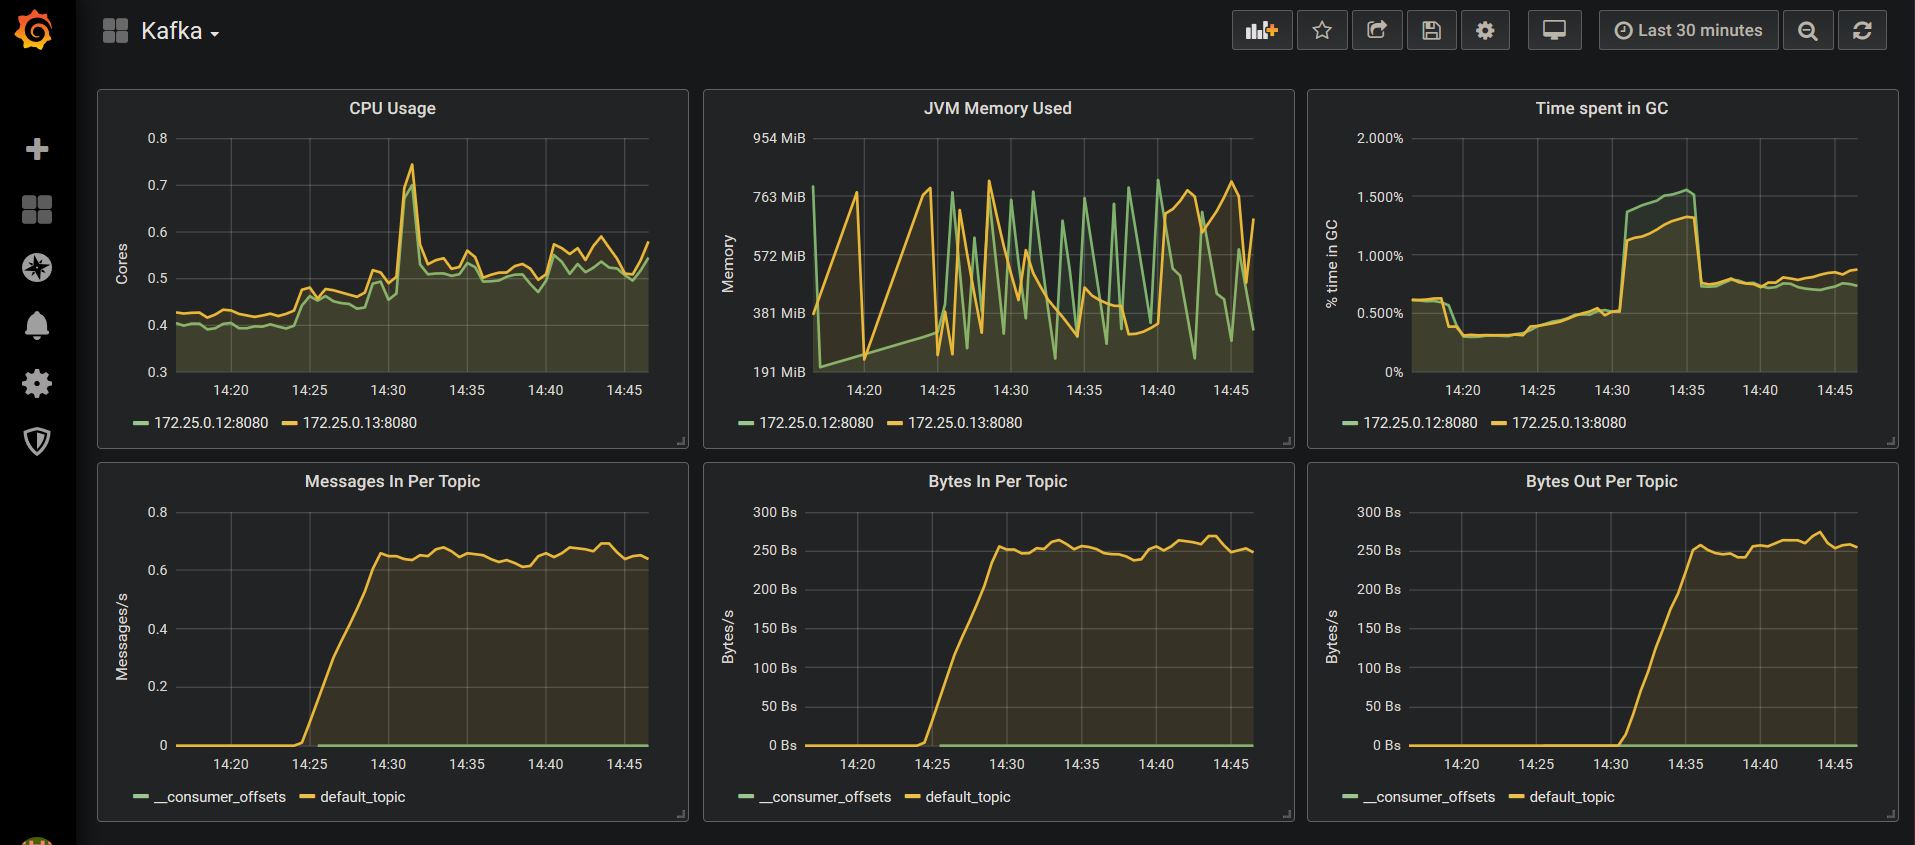
Finally, you can access the default kafka dashboard in Grafana (username is "admin" and password is "password") by going to http://172.25.0.16:3000/d/xyAGlzgWz/kafka?orgId=1


