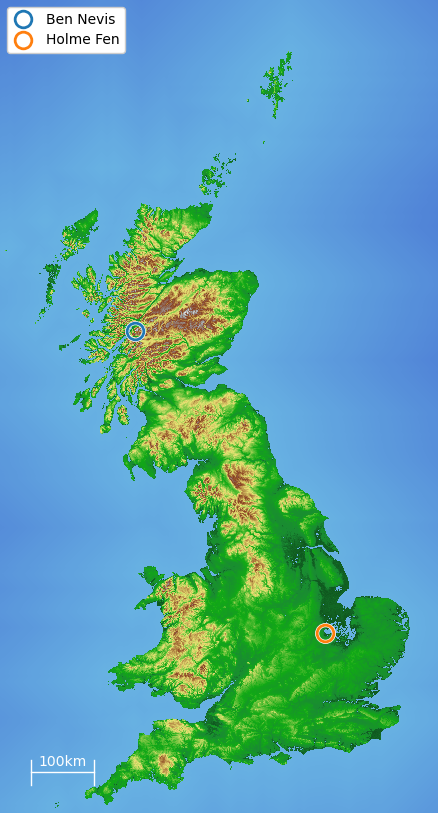
This repository contains the first files for a fun(?) project that tests optimisation methods on Ordnance Survey (OS) data for Great Britain.
Python 3.6 or higher, with pip-installable dependencies listed in requirements.txt (you can install these with pip install -r requirements.txt).
The additional package convertbng is recommended, but not required.
When first run, this script will download the data from the OS (about 160MB) and then convert it to a NumPy array stored on disk (about 1.5GB).
After downloading, run gb.py to download and unpack the data and test that all went well by plotting a map of great brittain.
(Don't worry, it'll be a lot faster the 2nd time.)
The amount of downscaling can be set using the variable downsampling.
An example with downsampling=32 is shown below.
Next, you can start fit.py to run a fit.
Results will be stored in the results directory.
This directory will also contain some other files, such as an .npy file storing a cached numpy representation of the downloaded terrain data (and optionally a file called spline that stores a cached spline).
Height information is from the Terrain 50 data set made available by the UK's Ordnance Survey. More information can be found here.
The data is divided into squares indicated with a two letter code, and several data files per square. However, each data file contains its absolute "eastings" and "northings", so we can ignore the letter codes. Eastings and northings are defined by the "National Grid", or OSGB36. In easier terms, they are x and y coordinates, in meters, relative to the bottom-left point of the grid (which is the bottom left of the square "SV", which contains the Isles of Scilly).
As an example, the header from the NN17 file is:
ncols 200
nrows 200
xllcorner 210000
yllcorner 770000
cellsize 50
Here ncols and nrows indicate the number of grid points in the file,
the Lower Left corner of the data in the file is given by xllcorner and yllcorner,
and the distance between any two data points is given as cellsize.
In the Terrain 50 data set, the cellsize is always 50 (giving it its name).
There is a more accurate Terrain 5 set that costs money.
According to wikipedia, the approximate coordinates for Ben Nevis are 216600, 771200 (which is in the NN17 square).
An easy way to find places on the grid is with https://britishnationalgrid.uk. Another nice map with BNG coordinates is https://explore.osmaps.com. A a great map without BNG coordinates can be found at https://opentopomap.org.
The sea is a bit messy in these files, as the values depend on mean sea level in each 10x10 km^2 area (OS Tile) relative to OS datum (0m) level which is mean sea level in Newlyn, Cornwall.
Names of hill and mountain tops are taken from The Database of British and Irish Hills v17.2, which is made available under a CC-BY license.
What about longitude (east-west) and lattitude (north-south)?
These are defined, it seems, by WGS 84, although there is a Europe-specific version called ETRS89 which "for most purposes ... can be considered equivalent to WGS84" ("Transformations and OSGM15 User Guide").
Transforming from national grid coordinates to longitude and lattitude is hard, and the Ordnance Survey have released a thing called OSTN15 to do this.
Although this still seems to result in x, y coordinates, not degrees.
Luckily, somebody's made a tool for it.
Unfortunately, some people have issues installing this, so that we rely on a less accurate fallback for the time being.
If you can, please manually install convertbng too (BenNevis will try using this first, before switching to bnglonglat).
To get heights for arbitrary points, we need to interpolate. By default, we use a linear interpolant. We also experimented with a scipy RectBiVariateSpline. This takes some time (~30 seconds on a fast machine) and uses considerable memory (~3GB). Most importantly, the spline shows some very serious (and unrealistic) artefacts near high gradients (e.g. at the sea side), so that the linear interpolation seems the way to go for now.
Proper API docs might be added at some point. For now, there are only a handful of public objects:
- data utilities (see
_data.pyfor details):benreturns grid coordinates (Coords) for Ben NevisCoordsrepresents grid coordinates and can convert to various formsdimensionsreturns the physical dimensions (in meters) of the GB height datafenreturns grid coordinates for Holme Fen, the lowest point (inland)gbloads and returns the heights data for GBHillrepresents a hill from the hills databaselinear_interpolantreturns a linear interpolant over the GB height datapubreturns grid coordinates for a random pub, selected from a very short listspacingreturns the physical distance (in meters) between grid pointssplinereturns a spline defined over the GB height datasquaresreturns the coordinates of major BNG squares
- plotting utilities (see
_plot.pyfor details)plotcreates a plot of a map, with optional labels etc.plot_linecreates a plot of the height profile between two pointspng_bytesturns a matplotlib figure into abytesstringsave_plotstores a plot and checks its size (only for paranoid people)
- others (see
_util.pyfor details)Timertimes and formats intervals
