This is a small toolkit to plot DOS, bandstructure and DOS+bandstructure in a nice way using matplotlib.
It relies on vaspkit, so it either needs the previously generated with vaspkit TDOS.dat / REFORMATTED_BAND.dat or the possibility to call vaspkit from command-line to try to generate the DOS/bandstructure files from the VASP files in the selected directory.
The plot is saved as a png file in the wokring directory (by default, but this can be changed by specifing the output filename, which determines the location and format using the plt.savefig function).
In order to execute it from any folder by simply typing "plvasp", you need to install it on PATH by simply running ./install.sh
Commands:
Mandatory (one of these formats):
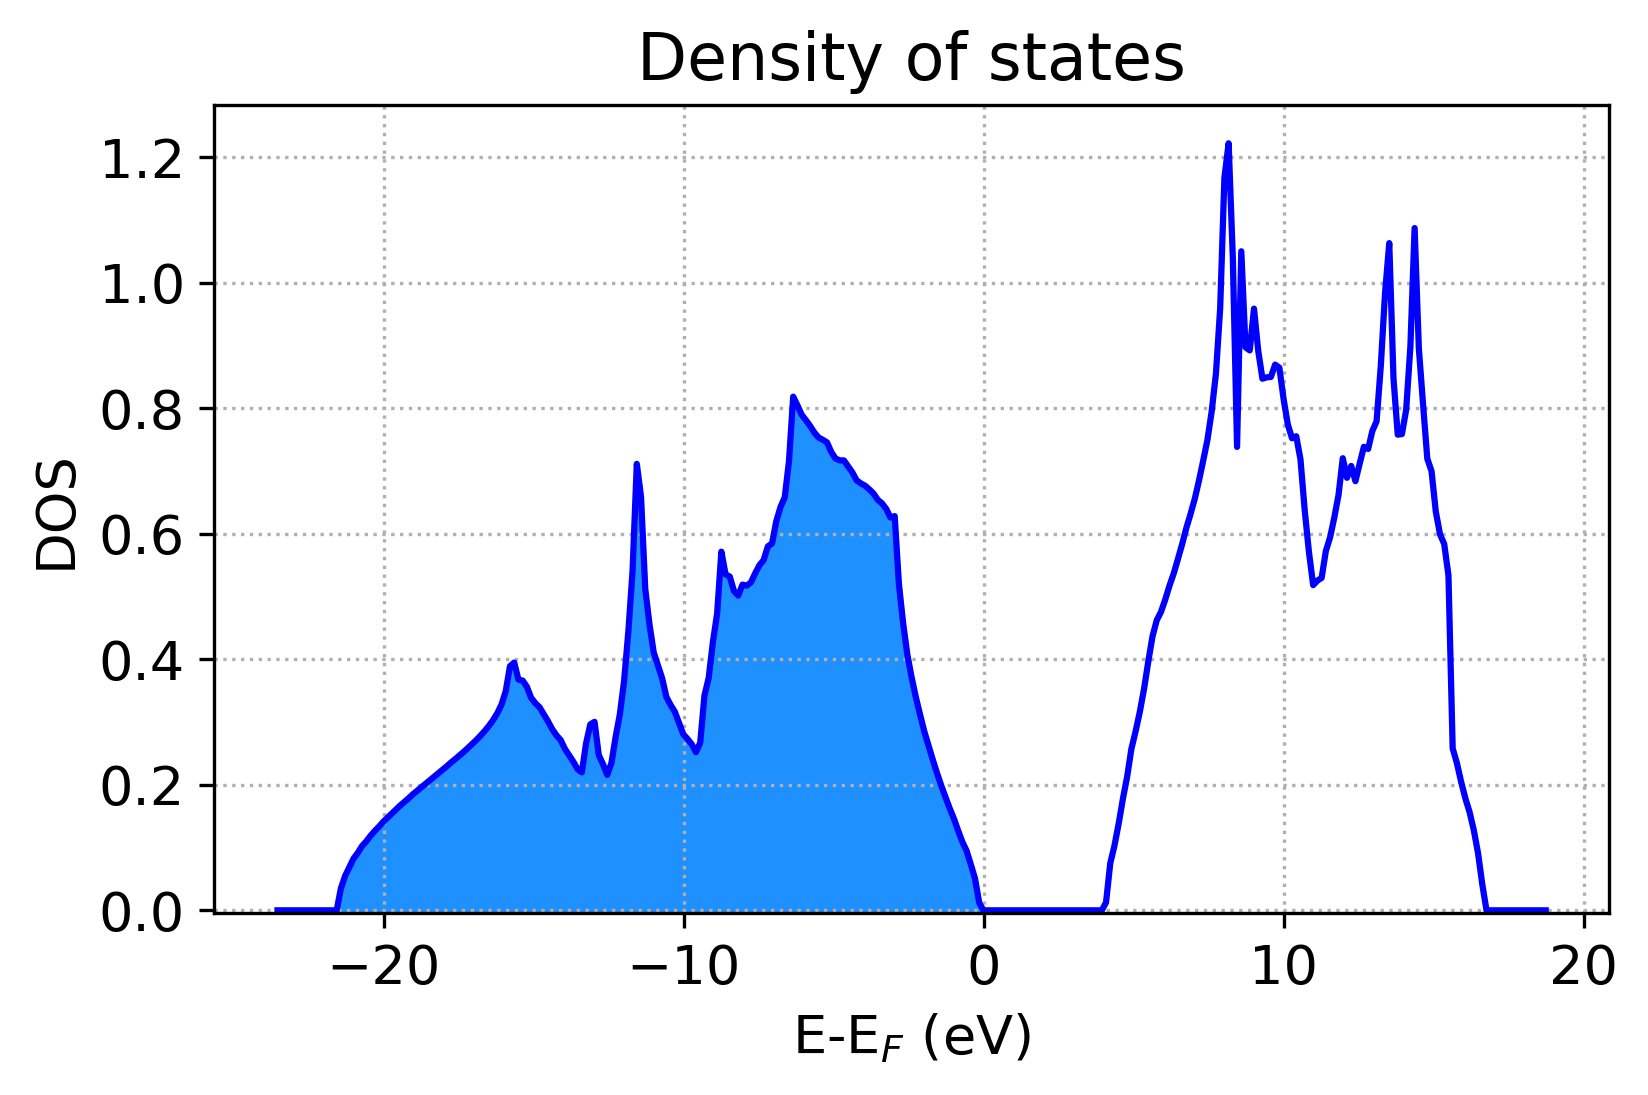
-d (FILE) : plot DOS. If FILE is not specified, it is assumed to be the TDOS.dat in the working directory.
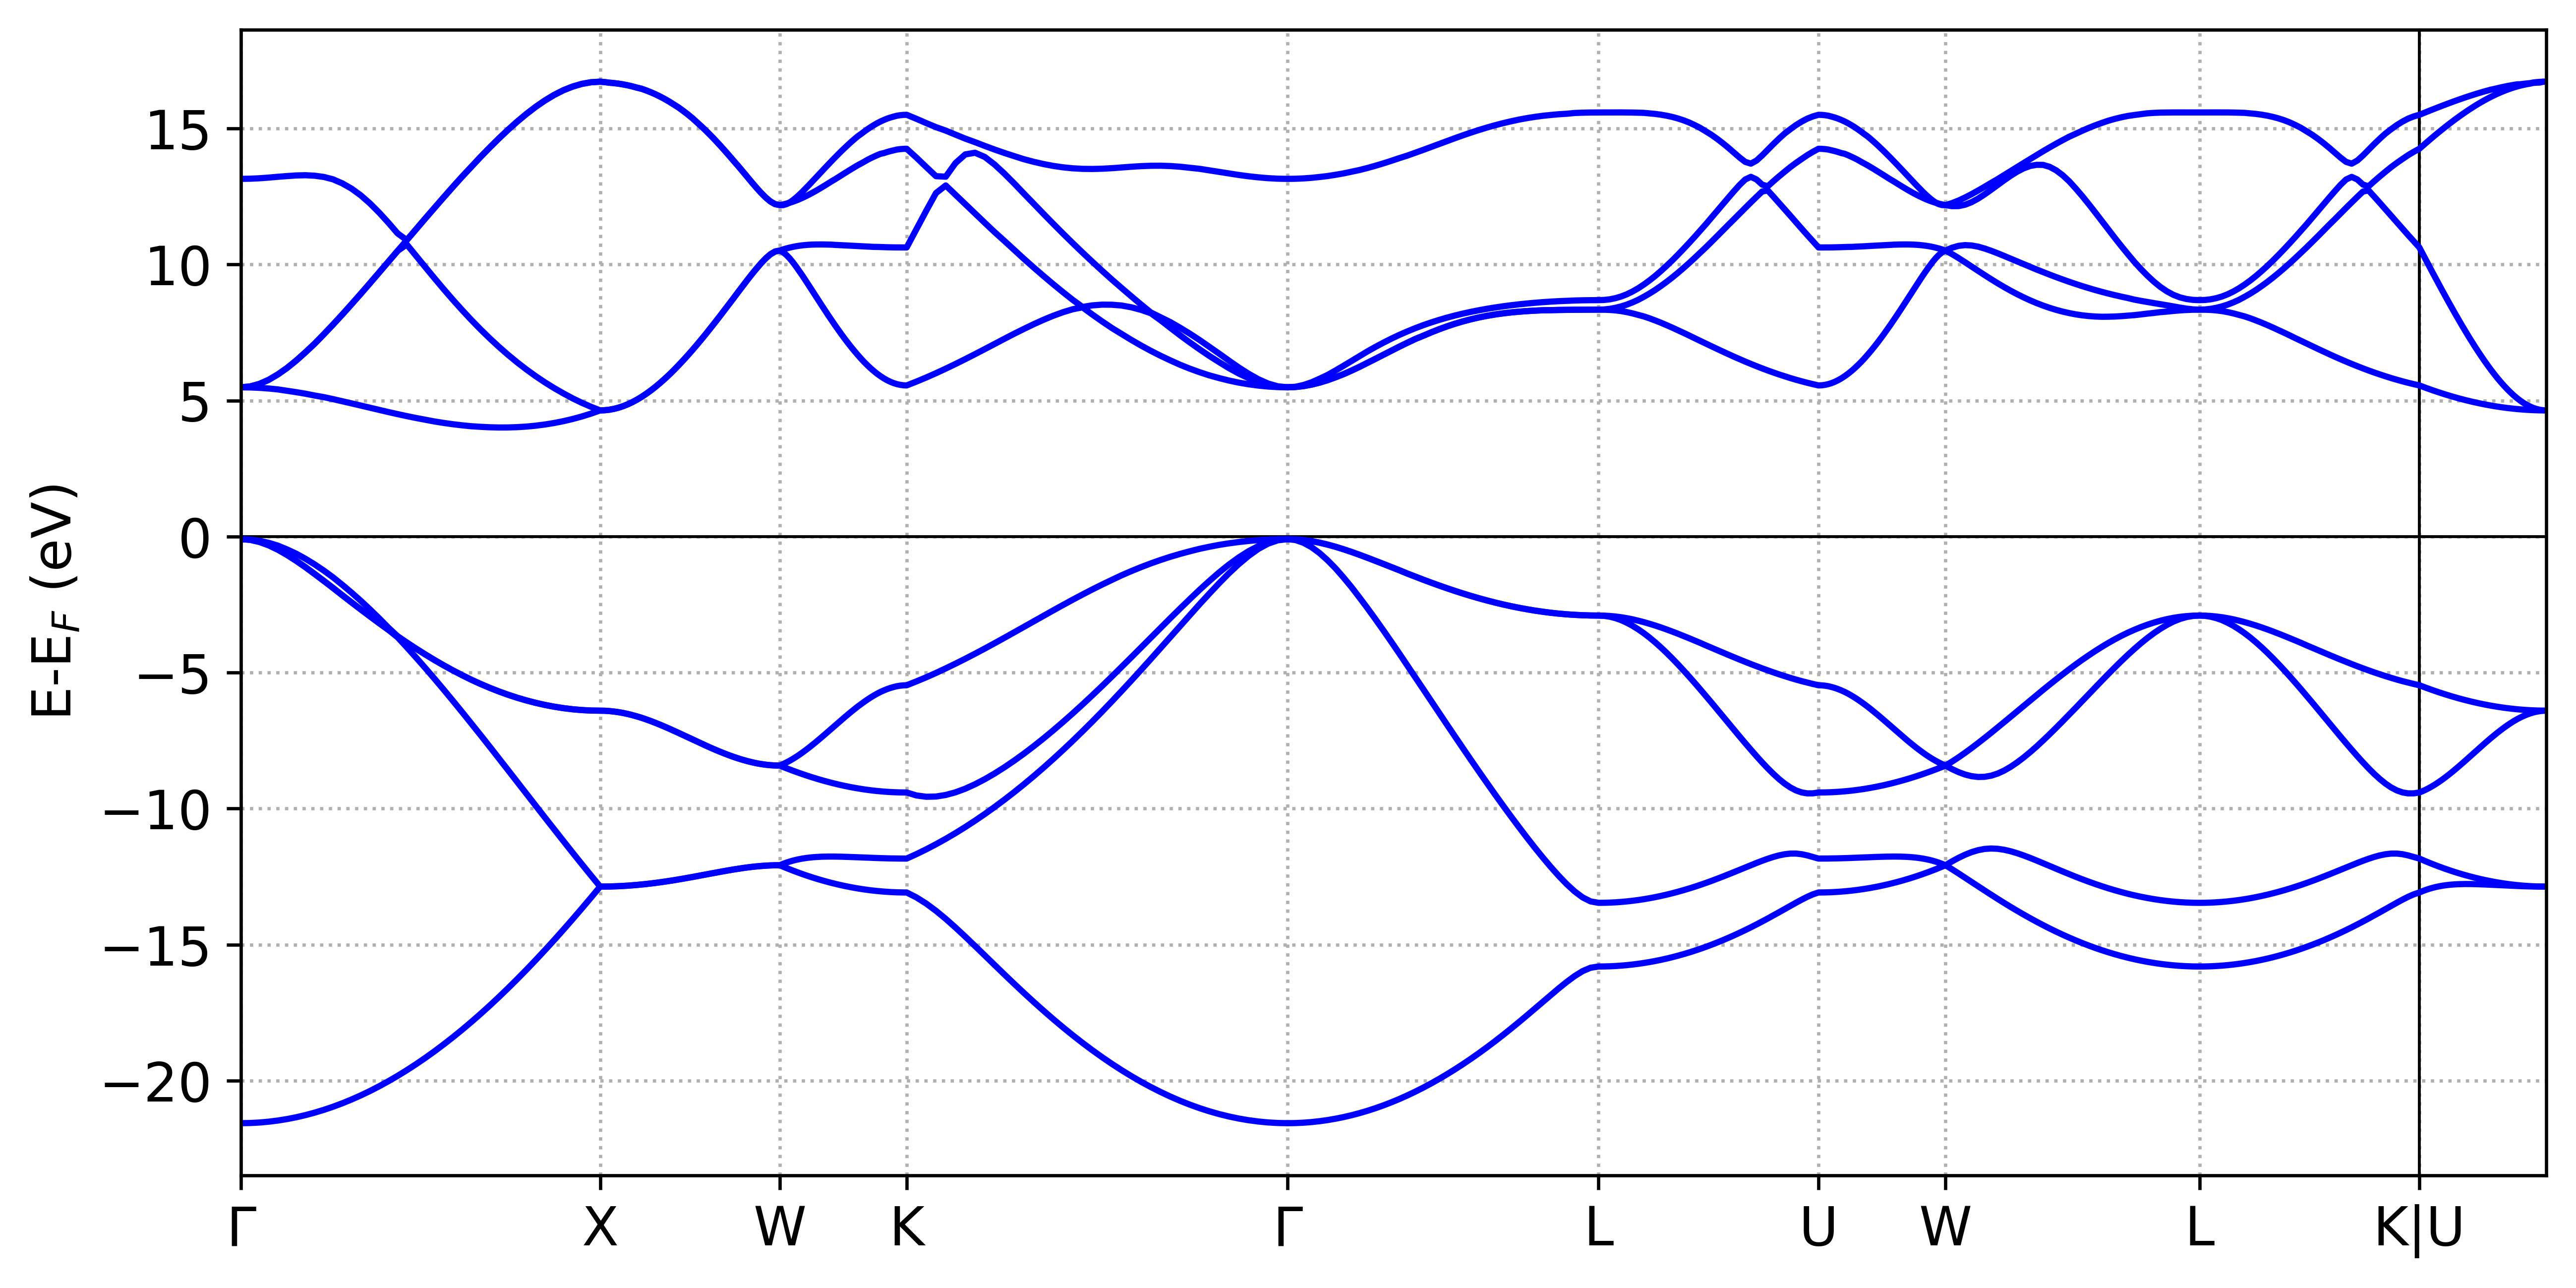
-b (FILE) : plot bandstructure. If FILE is not specified, it is assumed to be the REFORMATTED_BAND.dat in the working directory.
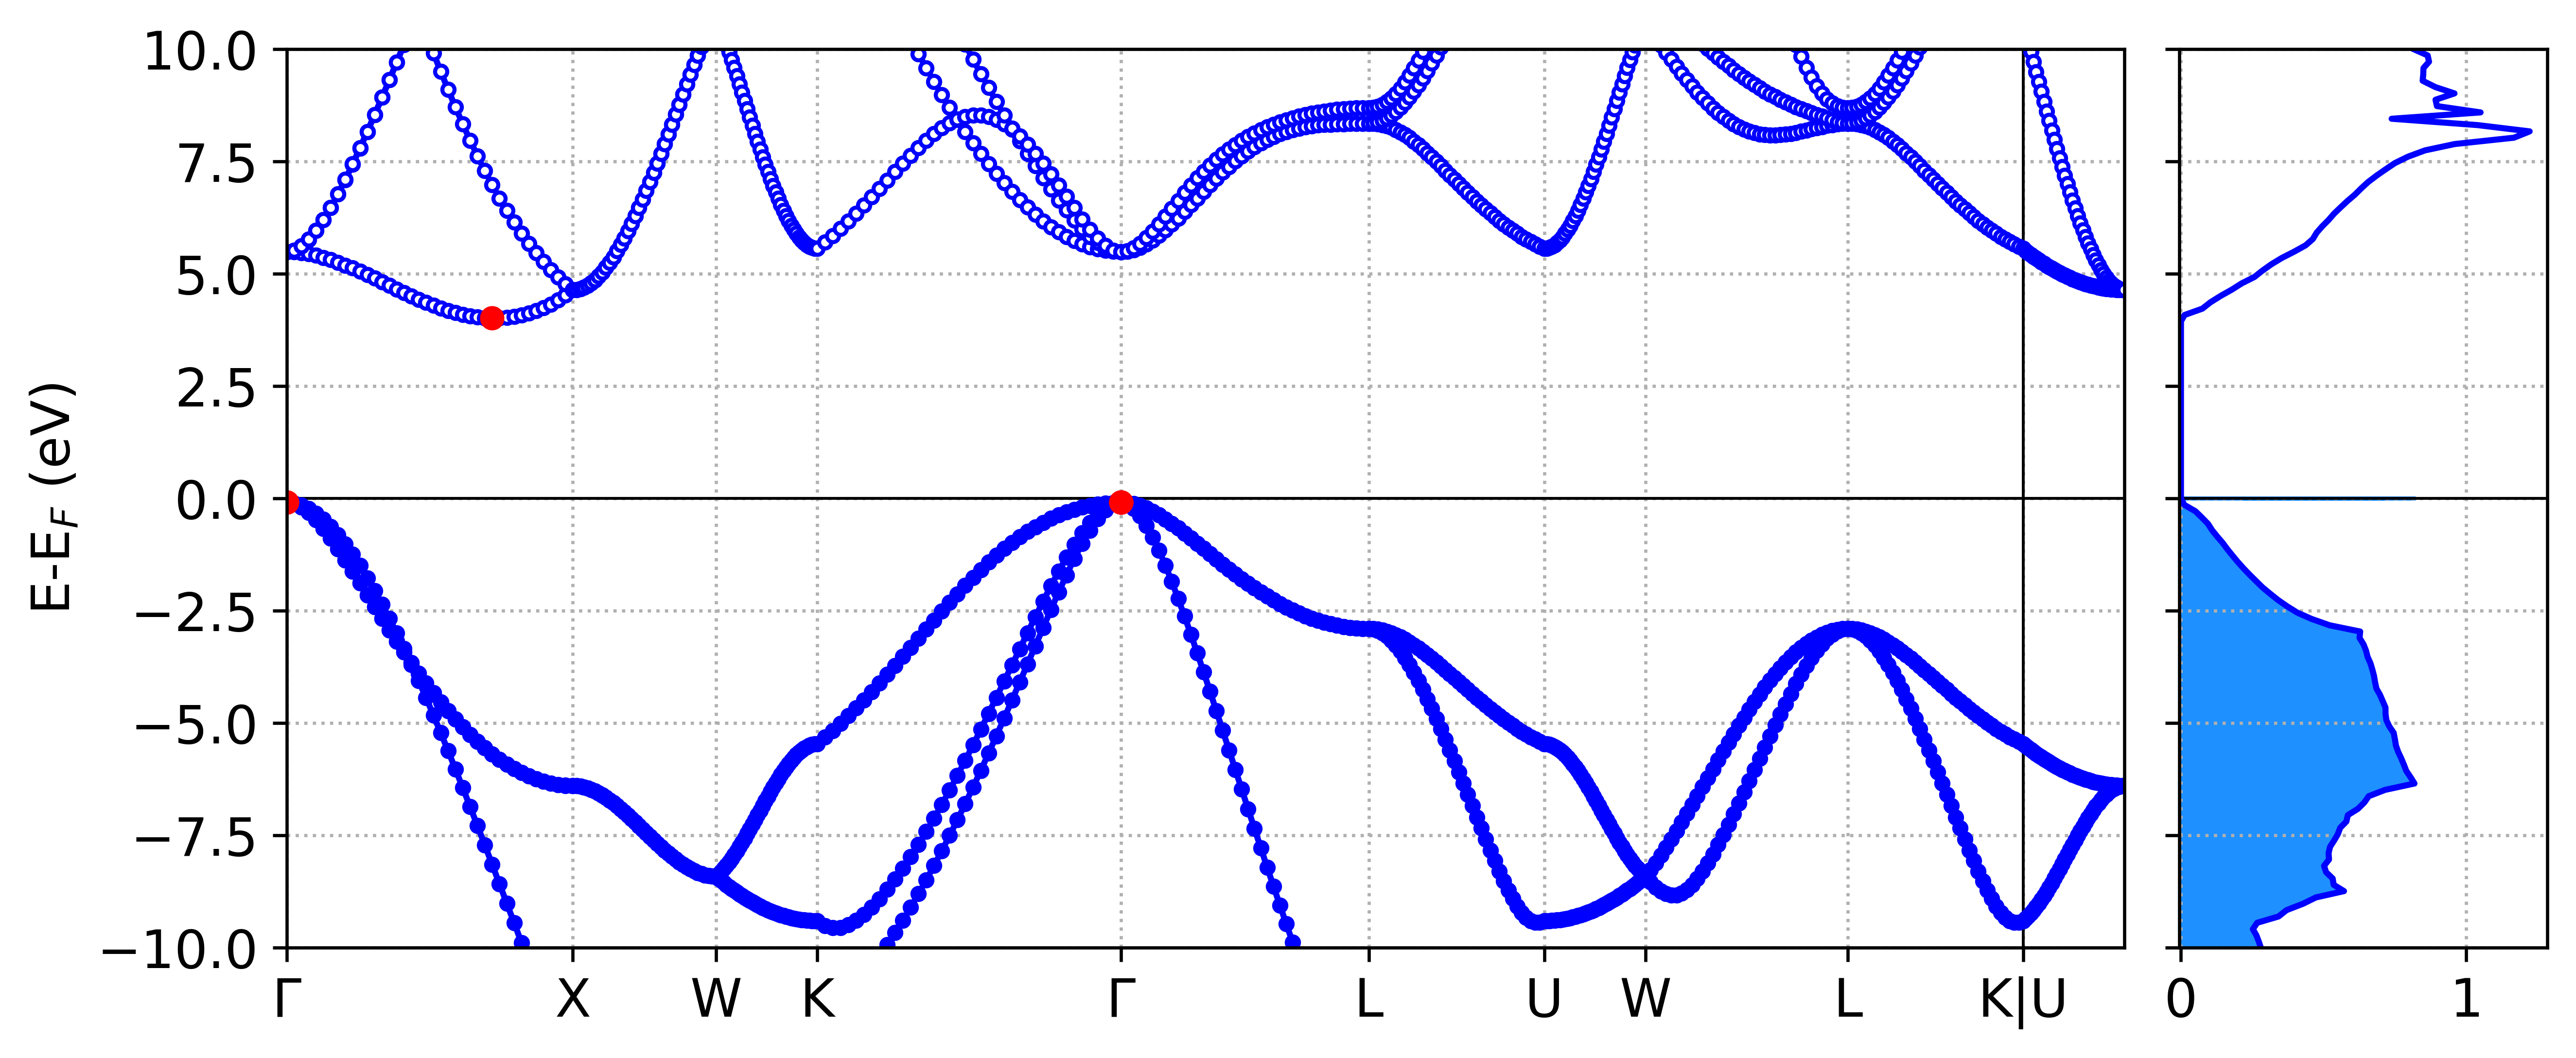
-d (FILE) -b (FILE) : plot DOS and bandstructure together (sharing y axis)
Optional:
-o OUTPUTFILE : specify custom ouput file name and location
--m : plot red points at the conduction band minimum (CBM) and valence band maximum (VBM) in the band structure
--r MIN MAX : energy range (both for DOS and bandstructure)
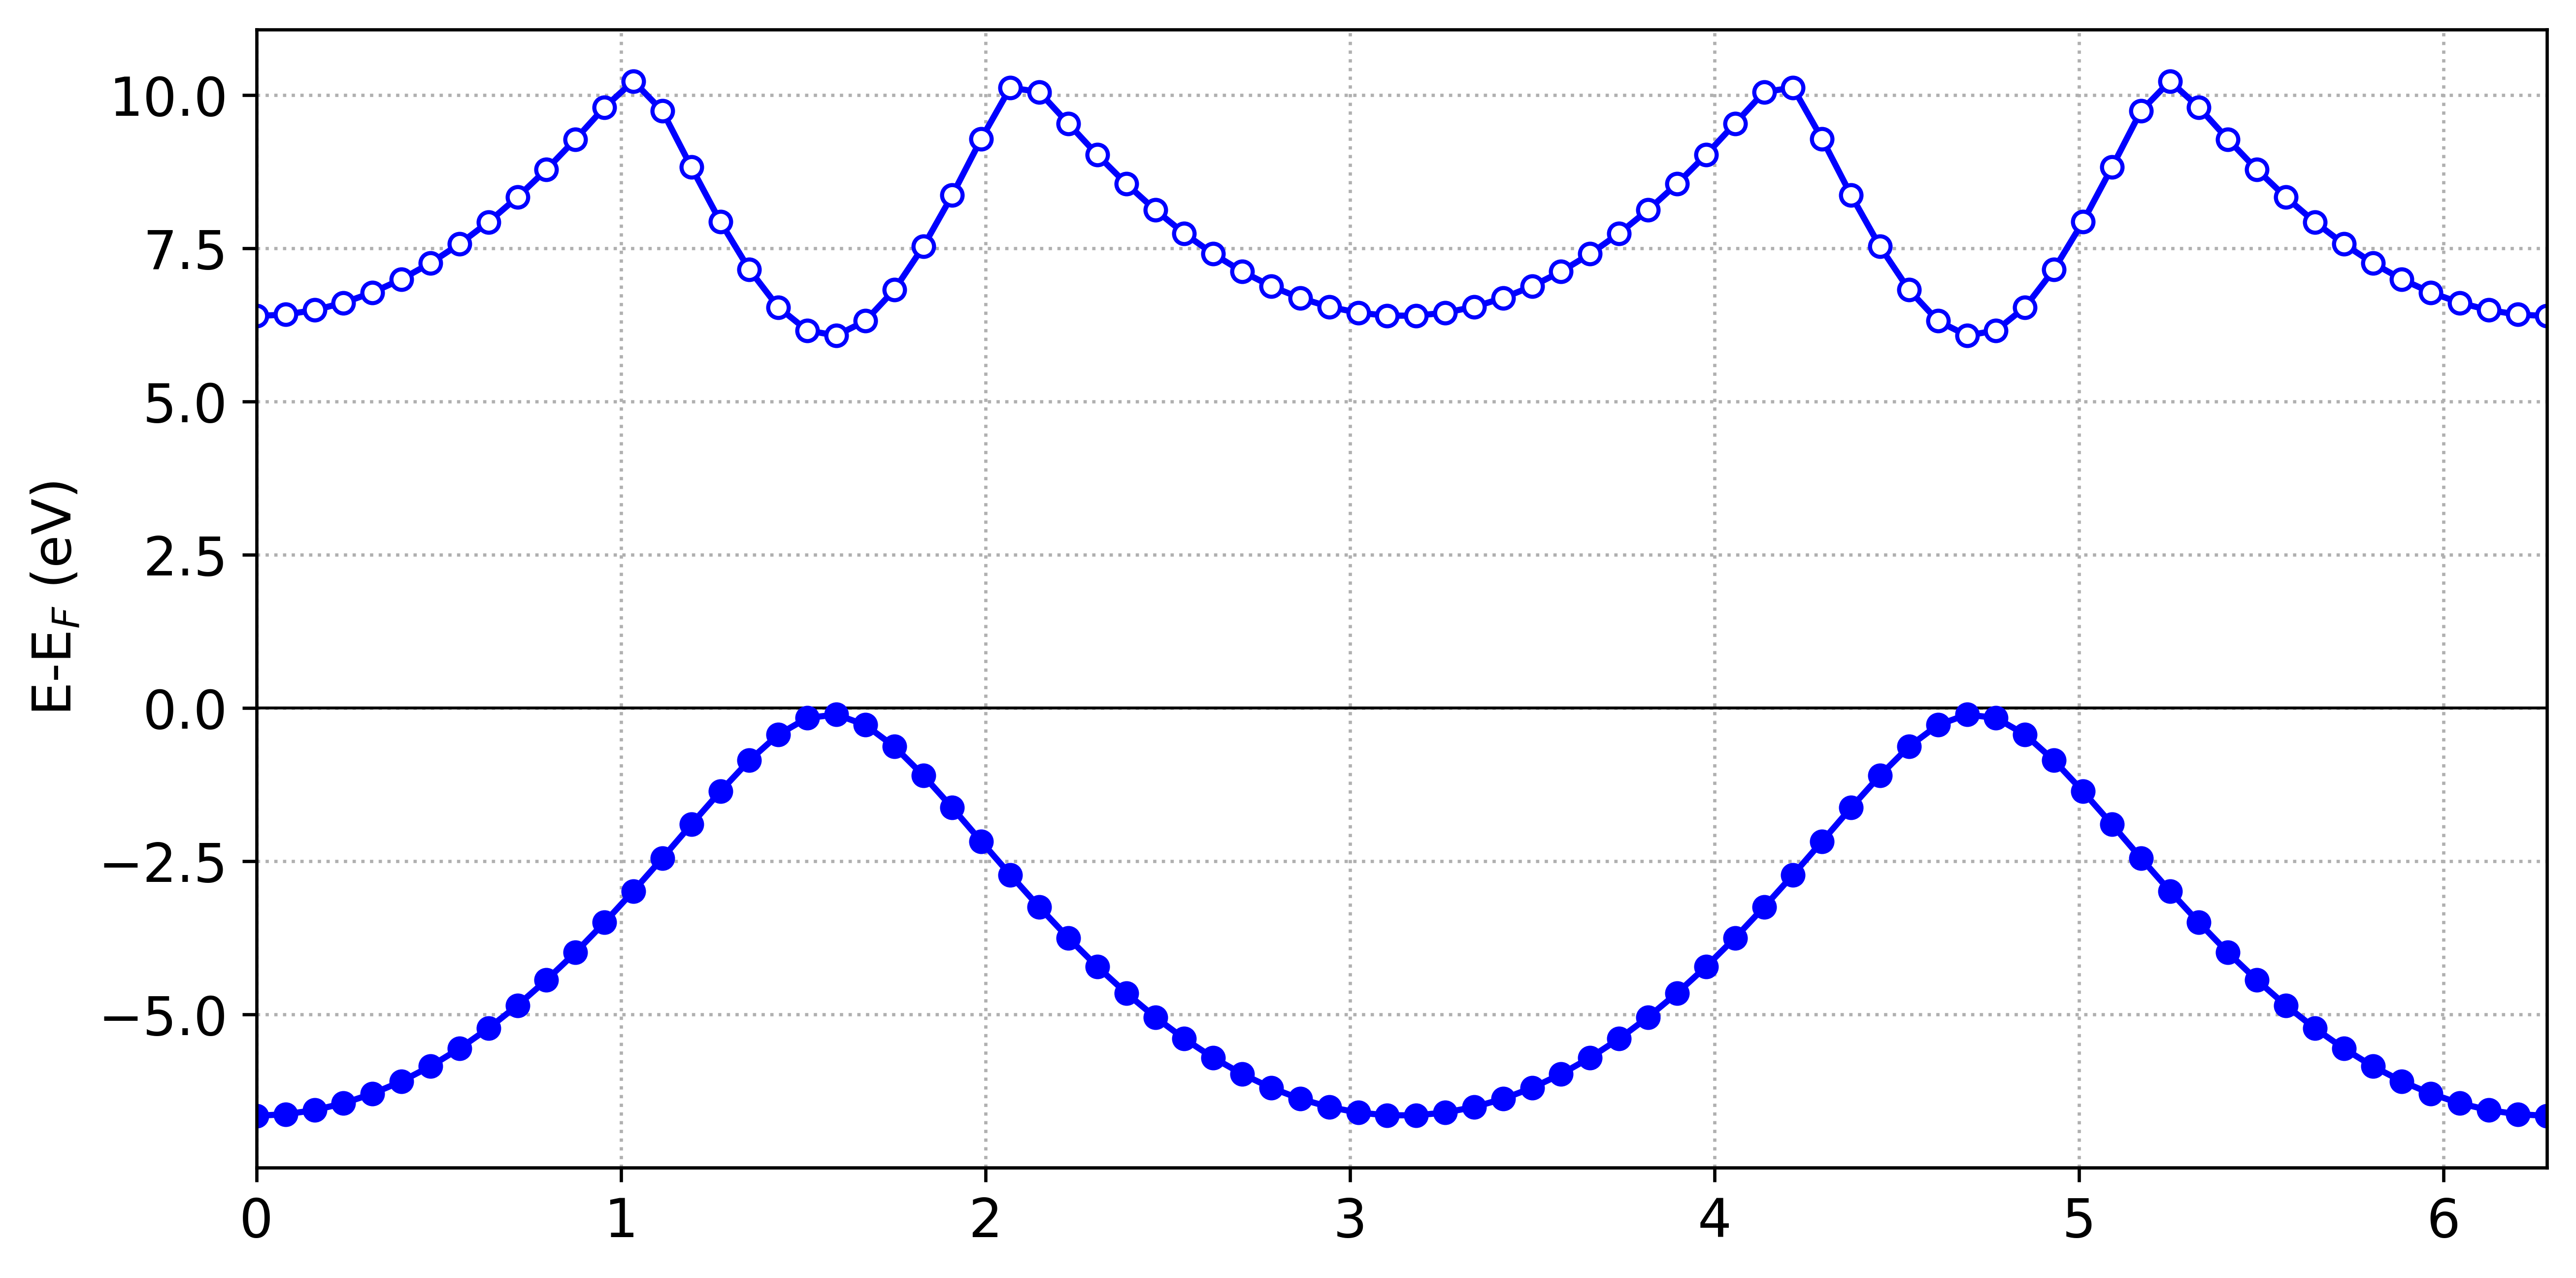
--ibands i_min i_max : plot only bands in the specified range. Indexing starts from 0 and the extremes are included, i.e. [i_min, i_max]
--points : draws bandstructure also with data points on top of lines
--su, --sd, --sud : plot spin up, down or both for DOS. If the calculation is non-spin polarized, this option will be ignored
If the TDOS.dat or REFORMATTED_BAND.dat files do not exist in the working directory or at the specified location, you will be asked if you want to try to generate them with vaspkit, in which case you need to confirm by typing 'y'.
Some example plots with the different options:
$ plvasp -d
$ plvasp -b
$ plvasp -d -b --r -10 10 --m --points
$ plvasp -b --ibands 0 1 --points


