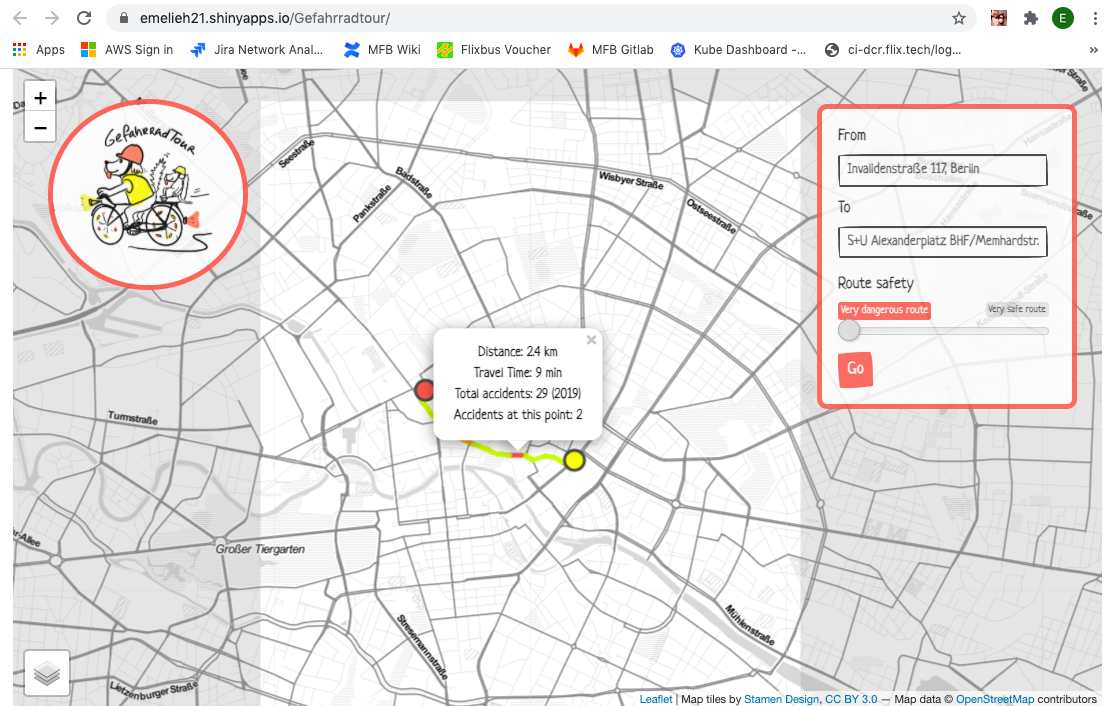
Find the safest route from A to B in Berlin with HERE Data Layers and Berlin traffic accident data. A project by Jordan Skubic, Jasmin Classen and Emelie Hofland for the HERE Map Data Hackathon 2020.
Road safety is an important issue in many cities. In Berlin in 2019 alone over 13.000 road accidents occured, every 2 hours a biker had an accident (over 5.000 accidents involved bikers) [1]. 34 accidents were fatal. We therefore created an app that shows you the shortest but also the safest route that helps you avoid dangerous streets and intersections to arrive safely to a destination of your choice.
The Gefahrradtour App is based on two data sets:
-
Navigable roads from HERE Data Layers The roads data set used for calculating the route between two points was provided by HERE for the hackathon in a geojson file. It contains 18916 road segments covering a section of Berlin which inlcudes most of its central districts (see Figure 1).
-
Accidents in Berlin 2019 This data set contains all accidents that occured in Berlin in 2019 [1] involving cars, bikers and pedestrians. For each accidents its coordinates, severity (from 1-3) and type are given. In total there where 13390 accidents recorded.
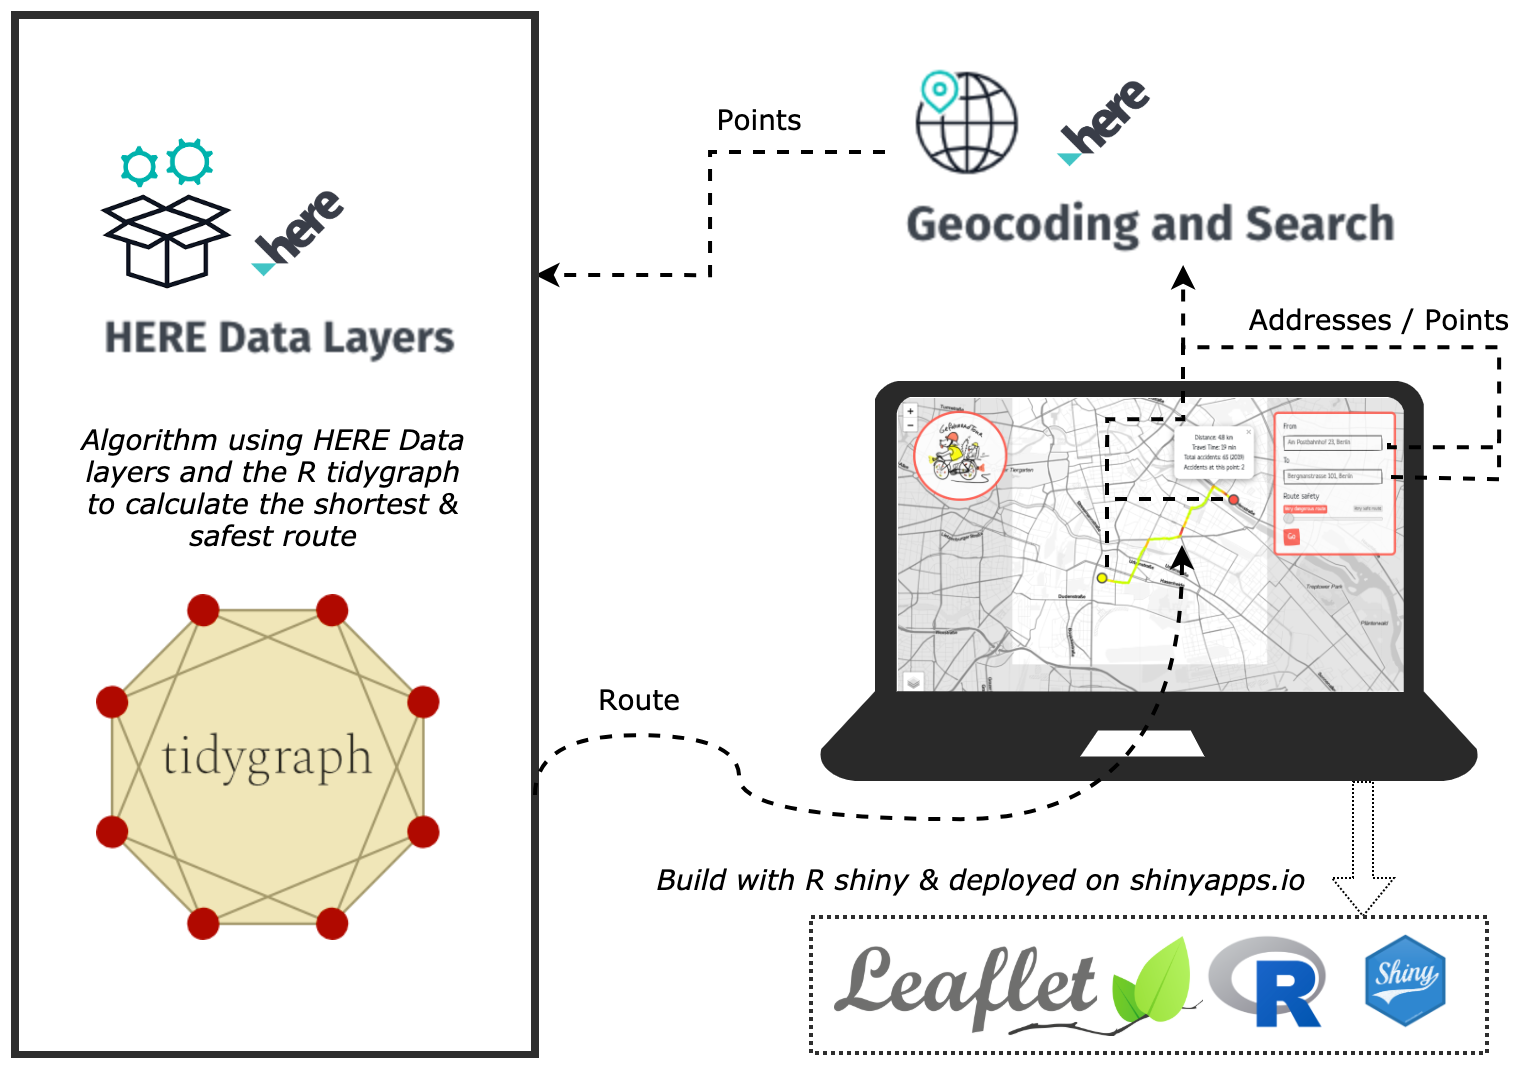
To find the route between two coordinates we used the navigable roads dataset in the HERE data layers. Using the tidygraph library in R [3,4], the road data was preprocessed into a graph G(V,E), where V represents its sets of nodes and E its set of edges. All road segments represent egdes and all intersections represent nodes. The road graph serves as input into the shortest path algorithm, for which we used the Dijkstra's algorithm [2]. This algorithm outputs the shortest path between two nodes in a graph. It takes into account the edges' weights. If the user selects the "very dangerous route" in the shinyapp, these edge weights are simply the length of each road segment. If "very safe route" is selected, we check how many accidents occured on a road segment and add 300 m to this edge's length for each accident that occured on it. We choose 300 m since this produced the most logical routes with a good balance of route safety and route length. We counted accidents with severe injuries as two accidents and those that lead to a death as three accidents.
The app allows the user to select a starting point and a destination (either by typing the address or clicking on the map) and to choose either the fastest route (very dangerous route) or the safest route (very safe route). Once the route is generated you can see which parts of the route are more dangerous (red color indicates higher number of accidents) and how many accidents happened on that route in total (based 2019 data).
The app can be visited here.
Currently, this demo version of the app is only available for a restricted area of Berlin for which we have data on navigable roads and accidents available. Not all cities will have such robust data on accidents, however the HERE data layers provide some possible avenues to extend Gefahrradtour to these cities. One such example is the information on signage. Within the area covered by the HERE signage data, we see that 70% of accidents involving bicycles occur where there is no traffic signage (within 20 meters), giving some indication that signs help to reduce to accidents.
There would need to be more rigorous analysis to contextualize this (e.g. total sign coverage and traffic volumes), but doing so in a more fleshed-out product would allow for a more flexible application to additional cities with only partial data coverage.
The app is built with R Shiny (see the app.R script). For all the mapping functionality, it used the Leaflet package and the theme applied is Bootstrap Sketchy. For the geocoding and reverse geocoding we used the HERE Geocoding and Search API. As explained above the routes are computed using an algorithm to find the shortest path between two points using the navigable roads data set from the HERE data layers and the tidygraph R-package [3]. We found the tutorial by Van der Meer et al. very useful for getting started with tidygraph [4].
The demo app is deployed with shinyapps.io. To use shinyapps.io, all you need is an account & the rsconnect package for R (install.packages("rsconnect")). Under Account > Tokens you can find the command with the credentials that looks something like this:
rsconnect::setAccountInfo(name='<YOUR USERNAME>',
	token='<YOUR TOKEN>',
	secret='<YOUR SECRET>')
After you run this in Rstudio, a tiny icon should show up next to the "Run App" button (when you have your shiny app script opened). Here you can select Publish Application.
The demo app can be found here: https://emelieh21.shinyapps.io/Gefahrradtour/.
- [1] Amt für Statistik Berlin-Brandenburg (2019). Strassenverkehrsunfälle nach Unfallort in Berlin 2019. mt für Statistik Berlin-Brandenburg (visited November 2020).
- [2] West, D.B. (1996). Introduction to Graph Theory. Upper Saddle River, N.J.: Prentice Hall.
- [3] Lin Pedersen, Thomas (2020). tidygraph: A Tidy API for Graph Manipulation (R package version 1.2.0). URL: https://CRAN.R-project.org/package=tidygraph
- [4] Van der Meer, L., Lovelace, R. and Abad, L. (September 26th, 2019). Spatial networks in R with sf and tidygraph. URL: https://www.r-spatial.org/r/2019/09/26/spatial-networks.html. Visited: December 7th 2020.


