R package for MLITSD’s Analytics Units.
Install the most updated version using remotes::install_github()
remotes::install_github("ETDAU/aulib")
Or, a source package using devtools::install_github()
devtools::install_github("https://github.com/ETDAU/aulib/releases/tag/v0.0.0.9000")
For those with access to ETDAU github repo, try installing from a
local directory:
install.packages(
  "C:/path to aulib folder",
  repos = NULL,
  type = "source"
  )
Alternatively, follow the steps below:
-
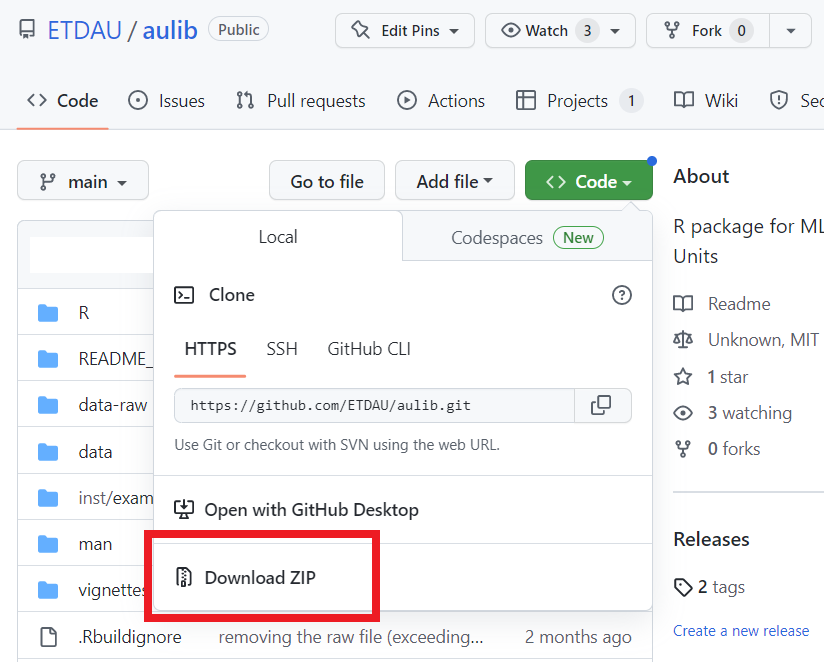
Download the repo
-
Unzip the
aulib-main.zipfile -
Install using
devtools::install()Make sure to change the path

devtools::install("C:\Users\your_name\Downloads\aulib-main")au_palette() provides a palette of accessible colours that are
recommended by the OPS
(palette = "ops") and are commonly used in the analytics units
(palette = "au").
# create fake data
tibble(w = sample(LETTERS[1:6], size = 100, replace = T)) %>%
  count(w) %>%
  # create a bar graph with the fake data
  ggplot(aes(x = w,
             y = n,
             fill = w)) +
  geom_bar(stat = "identity",
           position = position_dodge(.8)) +
  scale_fill_manual(guide = "none",
                    # using AU palette (Or leave the argument blank; `au_palette()`)
                    values = au_palette(palette = "au")) +
  scale_y_continuous("Count") +
  scale_x_discrete("") +
  theme_classic()
You can use both ops and au palettes by leaving the argument empty:
au_palette().
make_ca_connection() creates a connection object using an ODBC driver
with the log-in credentials saved as the system environment variables as
“userid” (user ID) and “pwd” (password). For saving your credentials in
your .Renviron, check this
instruction.
con = make_ca_connection()
rm_dup_response() is a helper function for cleaning duplicated
responses that are concatenated (e.g., “yes, yes”).
# create a vector of strings with some duplicated responses
tibble(duplicated_response = c("yes, yes", "no", "yes, no", "YES, yes",
                               "hello world, hello WORLD",
                               "hello world, bye world")) %>%
  # apply `rm_dup_responses()` to clean the duplicated_response column
  mutate(clean_response = rm_dup_responses(duplicated_response,
                                           sep = ","))
# A tibble: 6 × 2
duplicated_response clean_response
<chr> <chr>
1 yes, yes yes
2 no no
3 yes, no yes, no
4 YES, yes YES
5 hello world, hello WORLD hello world
6 hello world, bye world hello world, bye world
binary_to_numeric() converts “yes” and “no” responses to numeric
values of 1 and 0, respectively.
# create a string of binary responses
tibble(binary_response = c(sample(c("yes", "no"), 6, replace = TRUE), "YES")) %>%
  # apply `binary_to_numeric()` to convert into numeric values
  mutate(numeric_response = binary_to_numeric(binary_response))
# A tibble: 7 × 2
binary_response numeric_response
<chr> <int>
1 yes 1
2 yes 1
3 no 0
4 no 0
5 yes 1
6 no 0
7 YES 1
cross_validate() allows you to cross-validate recoding (e.g.,
dicotomizing, converting to numeric values) by comparing levels in the
original and transformed columns side by side.
Create a fake data set with some columns and recode these columns.
data =
  data.frame(x = sample(c("yes", "no", "maybe"),
                        100,
                        replace = TRUE),
             y = sample(LETTERS[1:5],
                        size = 100,
                        replace = TRUE),
             z = sample(LETTERS,
                        size = 100,
                        replace = TRUE),
             xy = sample(1:100,
                         100)) %>%
  #' transform variables
  mutate(x_yn = # dichotomize "x"
           ifelse(x == "yes", 1,
                       ifelse(x == "no", 0, NA)),
         across(y, # convert "y" into numeric
                ~case_when(. == "A" ~ 1L,
                           . == "B" ~ 2L,
                           . == "C" ~ 3L,
                           . == "D" ~ 4L,
                           . == "E" ~ 5L,
                           TRUE ~ NA_integer_),
                .names = "{.col}_num"))

head(data)
x y z xy x_yn y_num
1 no E S 49 0 5
2 yes C K 15 1 3
3 yes D W 5 1 4
4 yes D V 98 1 4
5 yes C X 9 1 3
6 no E E 20 0 5
To inspect whether/how the transformed levels correspond to the original
levels, use codebook = FALSE:
data %>%
  # exclude untransformed columns
  select(-c(z, xy)) %>%
  cross_validate(data = .,
                 suffix = c("yn", "num"),
                 codebook = FALSE)
[[1]]
x_yn x
1 0 no
2 1 yes
3 NA maybe
[[2]]
y_num y
1 1 A
2 2 B
3 3 C
4 4 D
5 5 E
To create a codebook with both original and transformed variables with
their corresponding levels, use codebook = TRUE:
cross_validate(data,
               suffix = c("yn", "num"),
               codebook = TRUE)
Warning in cross_validate(data, suffix = c("yn", "num"), codebook = TRUE):
Column(s) with too many levels (xy) were excluded.
# A tibble: 5 × 2
variable response_options
<chr> <chr>
1 x maybe, no, yes
2 x_yn 0 = no, 1 = yes, maybe
3 y A, B, C, D, E
4 y_num 1 = A, 2 = B, 3 = C, 4 = D, 5 = E
5 z A, B, C, D, E, F, G, H, I, J, K, L, M, N, O, P, Q, R, S, T, U, V, W,…
clean_query() is a function created by Tori
Oblad that facilitates importing
.sql queries into R by removing comment lines and line breaks from
queries.
aulib contains metadata documentation as data.
A subset of data from Statistics
Canada
containing economic regions and census divisions of IES catchment areas
(cduid).
geo_on_er_cd_names# A tibble: 50 × 9
est_region est_region_id cdname cduid cddguid_dridugd cdtype ername_renom
<chr> <chr> <chr> <chr> <chr> <chr> <chr>
1 Ottawa 10 Storm… 3501 2021A00033501 UC Ottawa
2 Ottawa 10 Presc… 3502 2021A00033502 UC Ottawa
3 Ottawa 10 Ottawa 3506 2021A00033506 CDR Ottawa
4 Ottawa 10 Leeds… 3507 2021A00033507 UC Ottawa
5 Ottawa 10 Lanark 3509 2021A00033509 CTY Ottawa
6 Kingston--Pem… 4 Front… 3510 2021A00033510 CTY Kingston--P…
7 Kingston--Pem… 4 Lenno… 3511 2021A00033511 CTY Kingston--P…
8 Kingston--Pem… 4 Hasti… 3512 2021A00033512 CTY Kingston--P…
9 Kingston--Pem… 4 Princ… 3513 2021A00033513 CDR Kingston--P…
10 Muskoka--Kawa… 7 North… 3514 2021A00033514 CTY Muskoka--Ka…
# ℹ 40 more rows
# ℹ 2 more variables: eruid_reidu <chr>, erdguid_reidugd <chr>
Documentation containing metadata of CA data and information about Common Assessment questions. This is useful for manipulating and transforming CA data (e.g., pivoting into a wide-format).
2021 NOC codes, corresponding job titles, skill levels, and TEER.