Follow us on Instagram || Follow us on Twitter || Follow us on GitHub || DR.GROOT

For MacOS and Window go with Download SageMath to Download the Software, its open source so no trouble in downloading.
After SageMath is installed, see that you have Jupyter Notebook if not go with link to download CLICK HERE.
We will be using Jupyter Notebook as our primary workspace, So lets get Start now.
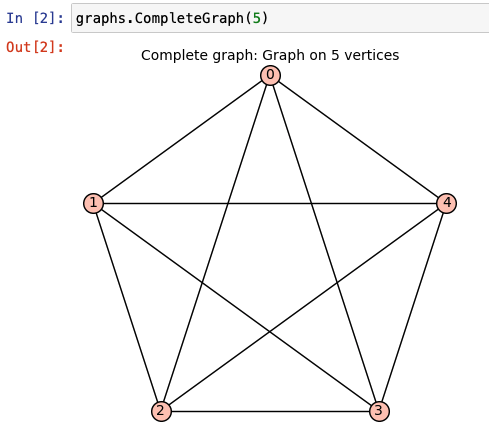
For making a complete graph we use graphs.CompleteGraph() as in arguement we can give the number of vertices or nodes.
A Complete Graph is a graph in which all nodes are connected to all other nodes.
For Example:
Lets say we want to make a Complete Graph with 5 vertices then we will go with graphs.CompleteGraph(5) on our Jupyter Notebook.
Lets define a variable K5 and store graphs.CompleteGraph(5) in it. And to display the K5 we use K5.show()

Lets make it more excited by building a 3D COMPLETE GRAPH with 5 Vertice just going with K5.show3d().

Amazing thing about 3d Graph is, you can Rotate it using your cursor or you can go with spin = True as an arguement of show3d()
3D Graphs feature is supported by Safari and Internet Explorer Web Browser and JDK should be installed.
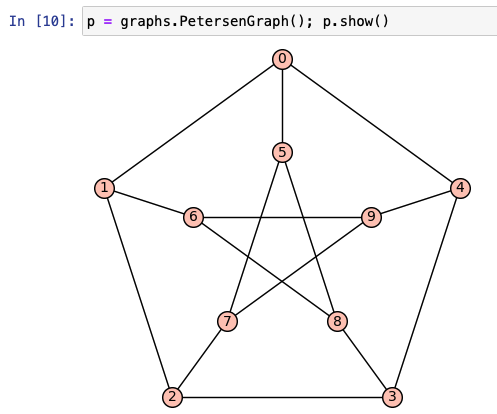
PETERSEN GRAPH
The Petersen Graph is a named graph that consists of 10 vertices and 15 edges, usually drawn as a five-point star embedded in a pentagon.
The Petersen Graph is a common counterexample. For example, it is not Hamiltonian.
For this we have to go wtih graphs.PetersenGraph() and then show()
And For 3d we will go with same command show3d()
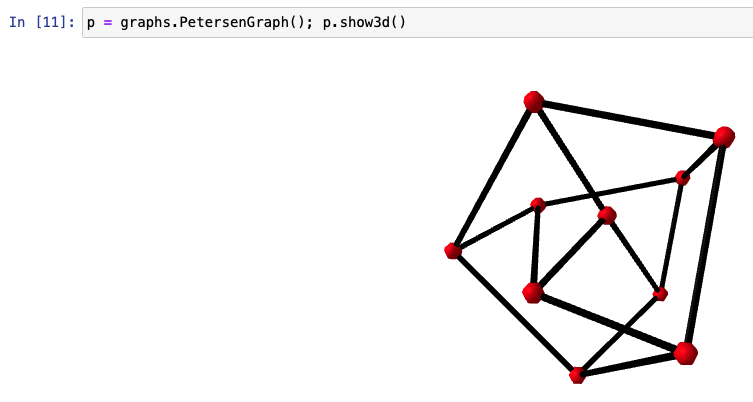
Basically 3D graphs are used for finding Isomorphism or comparing two graphs together.
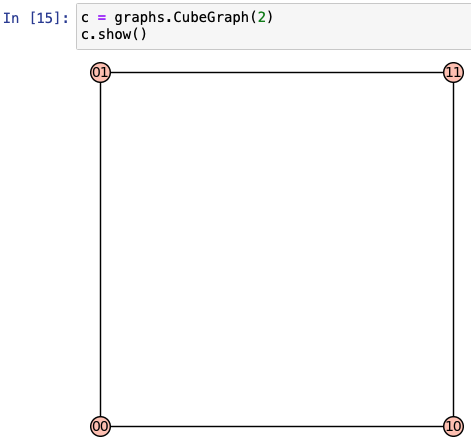
CUBE GRAPH
Just go with graphs.CubeGraph(n)
Return the n-cube graph, also called the hypercube in n dimensions.
The hypercube in n dimension is build upon the binary strings on n bits, two of them being adjacent if they differ in exactly one bit. Hence, the distance between two vertices in the hypercube is the Hamming distance.
And for 3d Graph version we will go with show.3d() and we will get :
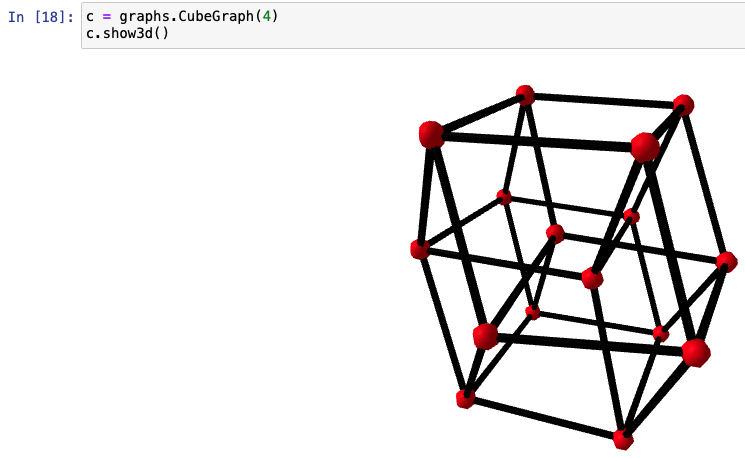
Cube Graph are use in CPU's now they gave small little CPU's as you can in those node and they are connected to each other and this mean of quad core dual core and so on.
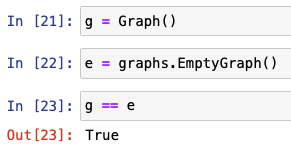
EMPTY GRAPH
Now lets create an empty graph wich means graph of 0 vertices, it is created by Graph() or by graphs.EmptyGraph().
I can proove that both can create an Empty Graph by comparing them:
Now if i want to create a graph with 5 vertex, we just go with Graph(5) :

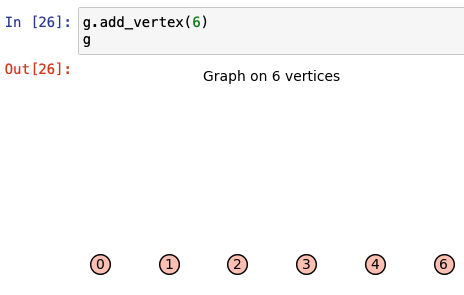
We can add vertex to the Graph G by g.add_vertex(6) and then display g
Something is like missing out, Edges Right!
So if we want to add edge between vertex 0 and 1 then we will go with g.add_edge(0, 1)
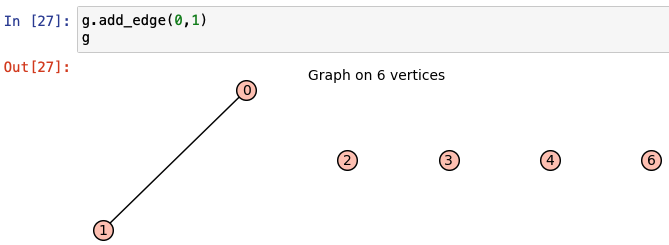
And So on we can go with this command to add edges.
Now lets display the vertex and edges by :

It is showing 0 and 1 edges that i have created now.
We can add multiple Edges by :

Now lets look over to the Total Edges we have:

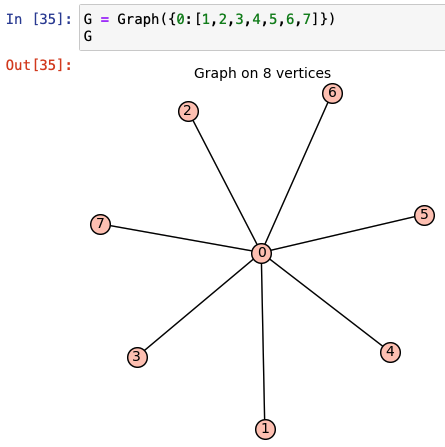
if i want a Graph with 0 vertex connected to 1,2,3,4,5,6 and 7 Then:
Want a Graph with vertex 0 connected to 1, 2 and 1 to 2,3 and 2 to 3 So then:

Giving each edge a name, we have to write like:
G = Graph({0:{1:'x',2:'z', 3:'a'}, 2:{5:'out'}}) and with that we have to specfy G.show(edge_label=True) to ensure labels are visible.

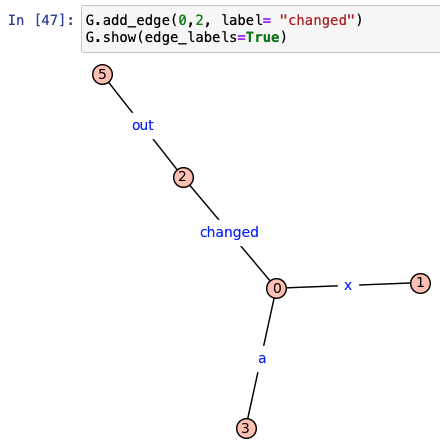
If we want to change the edge name between 0 to 2 as changed we can do like this:
G.add_edge(0,2, label='changed') and G.show(edge_label=True)
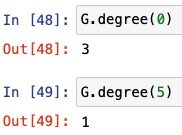
If we want to find out the degree of a vertex, then we use .degree(n) where n is a vertex.
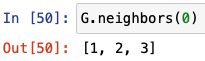
To find the neighborhood of the vertex, we use .neighbors(n), where n is the vertex.
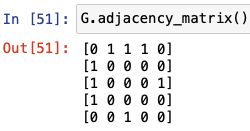
Getting the Adjacent Matrix of the Graph, by using .adjacency_matrix().
Getting the Incidence Matrix of the Graph, by using .incidence_matrix().

Now other type of Graph is DiGraph, for that use Digraph()

you can also go for 3d version of it by .show3d()
For builting a multigraph with multi edges:

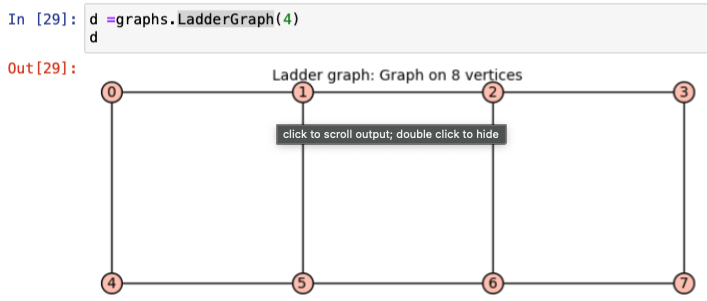
To draw Ladder Graph we use function graphs.LadderGraph()
Its easy to find this just give ? after each command to know about what it does.
Lets say whats graphs.CompleteGraph() do we just write graphs.CompleteGraph? and we get a pop up window like this -
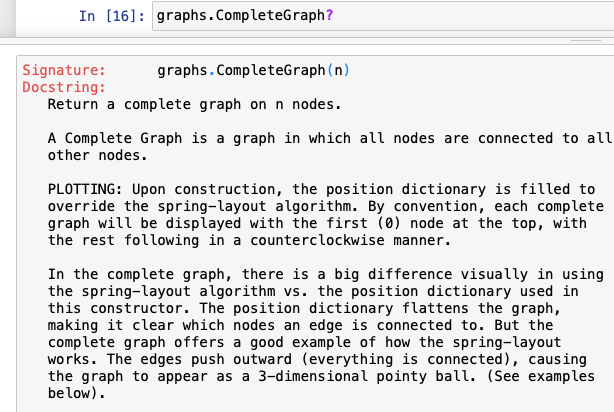
Following with the instructions how to use this following statement.