metricsWorkshop
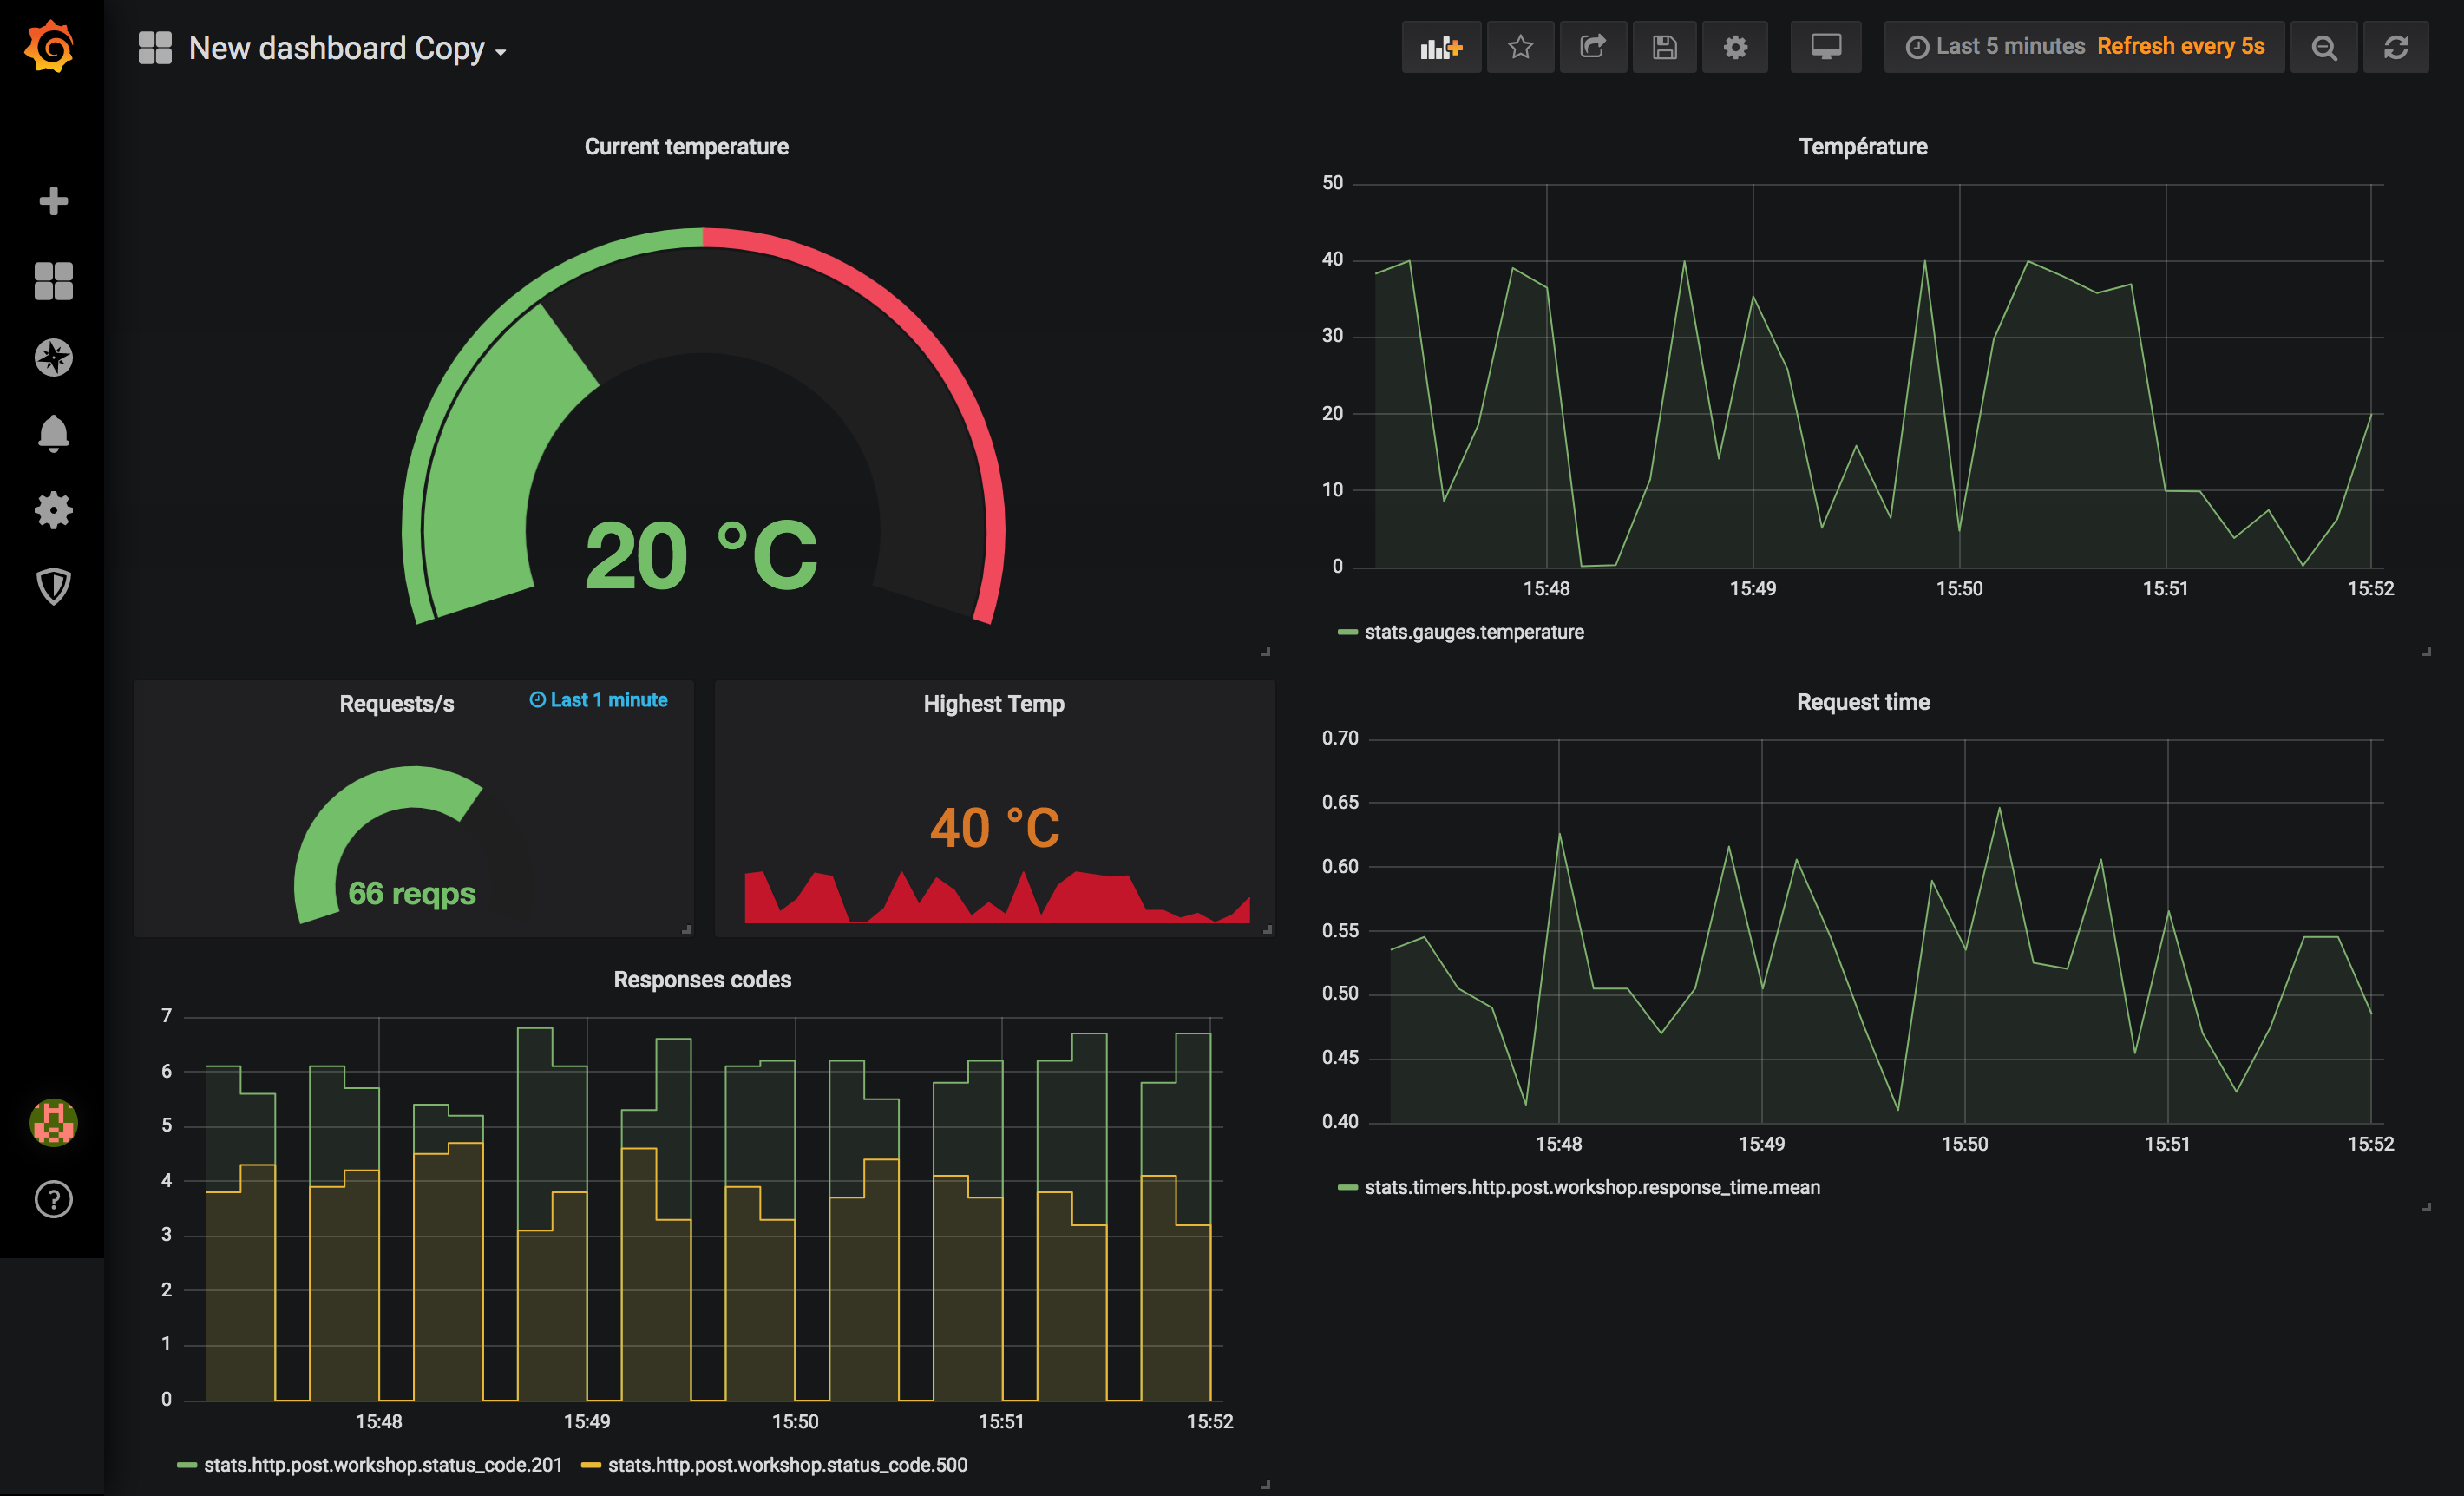
We have a temperature sensor in a room that records the temperature and sends it to a server. We want to monitor the temperature and server stats.
Instructions
Start graphite and grafana
docker-compose up -d graphite grafana
Check on your browser: http://localhost:3010 .
user: admin pwd: admin
Install server and sensor dependencies:
docker run -v $(pwd):/app node:11 bash -c "cd app && npm install"
Start your server and temperature sensor:
docker-compose up -d sensor server
If you change the code you can reload by doing:
docker-compose stop sensor server && docker-compose up -d sensor server
First step
- Create a simple temperature graph.
- Create the responses code graph
- Create the others graph that you see on the screenshot, start by your favorite
- play with the sensor paramaters
Goal
Create all the graphs present on the screenshot

You can always cheat and visual the whole board with the file grafana-final.json.