An infovis dashboard for international migrant stock from 1990 to 2020 on UNIMS 2020.
For a complete overview, download the recorded .mp4 video from here or by clicking on the image above.
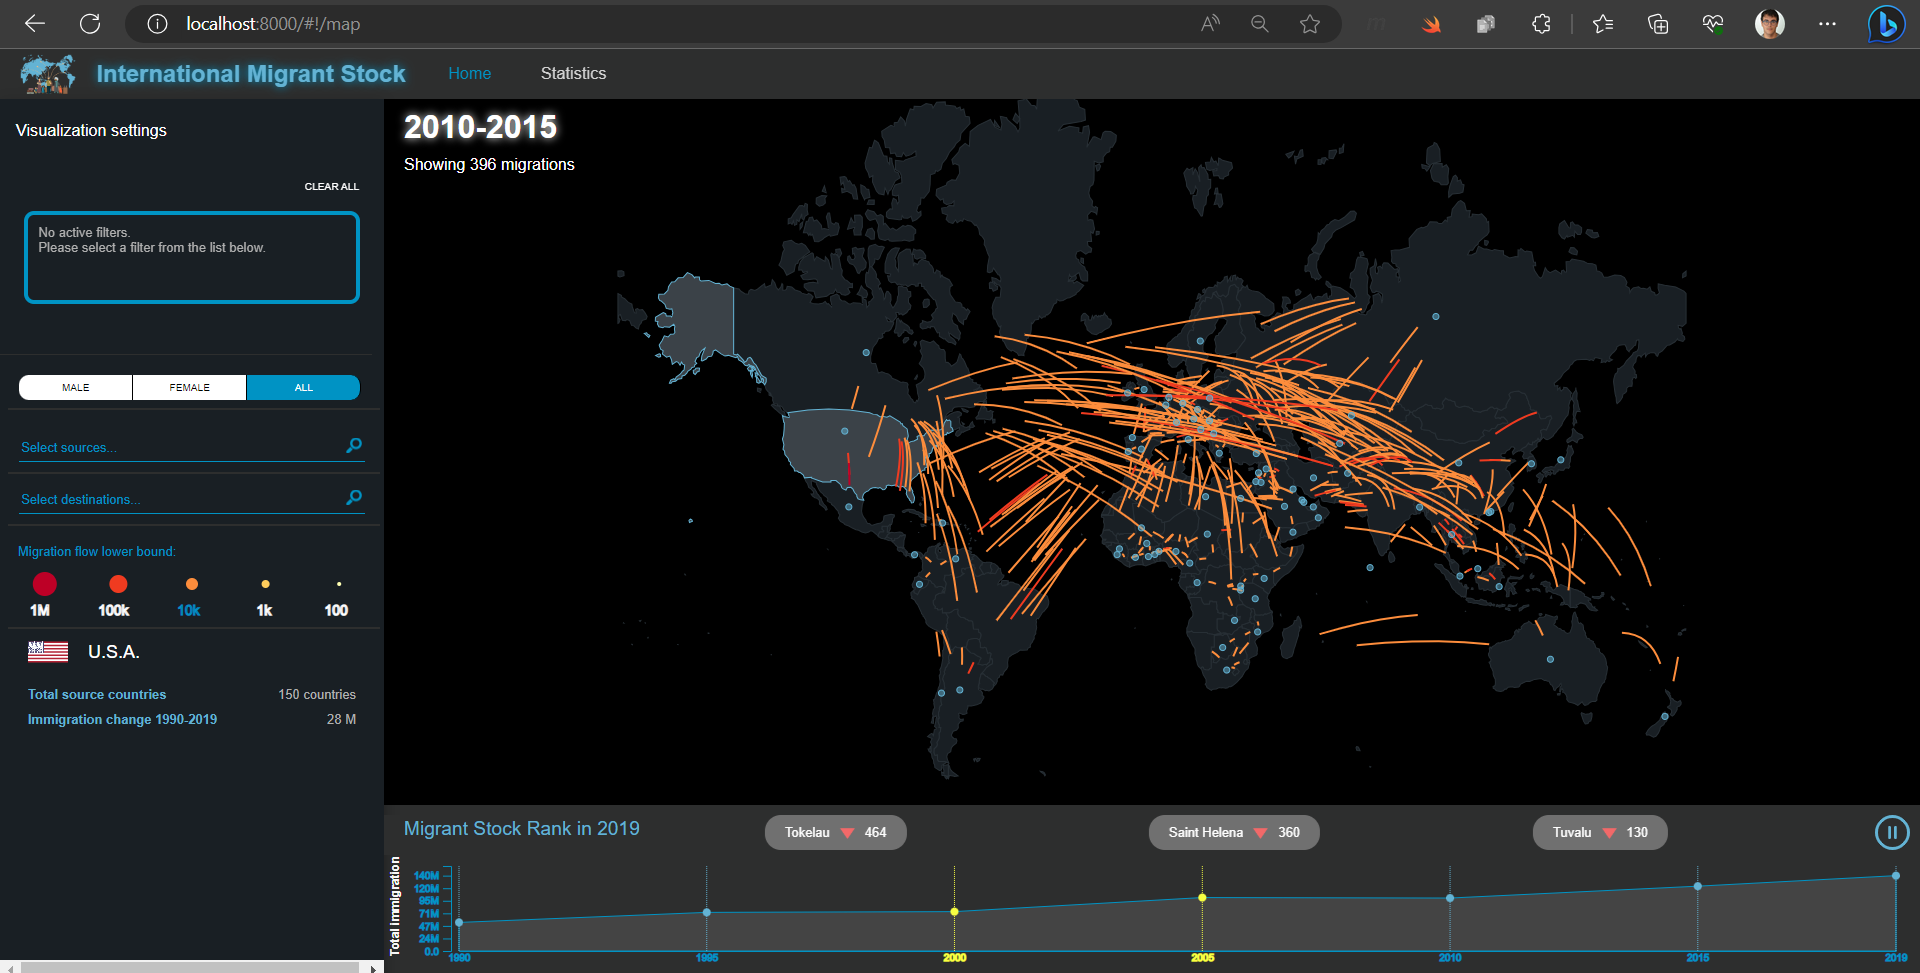
The proposed infovis dashboard is a dynamic and interactive tool designed to assist data analysts and general users in monitoring the trends and changes in international migrant stock from 1990 to 2020.
The dashboard, built using Angularjs and D3.js, offers intuitive visualizations, powerful filtering options, and distinct panels to help users understand global migration patterns over time, focus on country-specific or country-to-country aspects of interest and make informed decisions based on the observed trends.
cd dashboard/
npm cicd dashboard/
python -m http.server 8080Then, open localhost:8080 in your browser.
The dashboard sources its data from UNIMG 2020, a comprehensive and regularly updated census dataset maintained by the United Nations. The dataset provides detailed information on international migrant stock, capturing data at five-year intervals up to the year 2020 (so far). By making use of an authoritative dataset, we are able to ensure accurate and reliable information for both analysis and exploration.