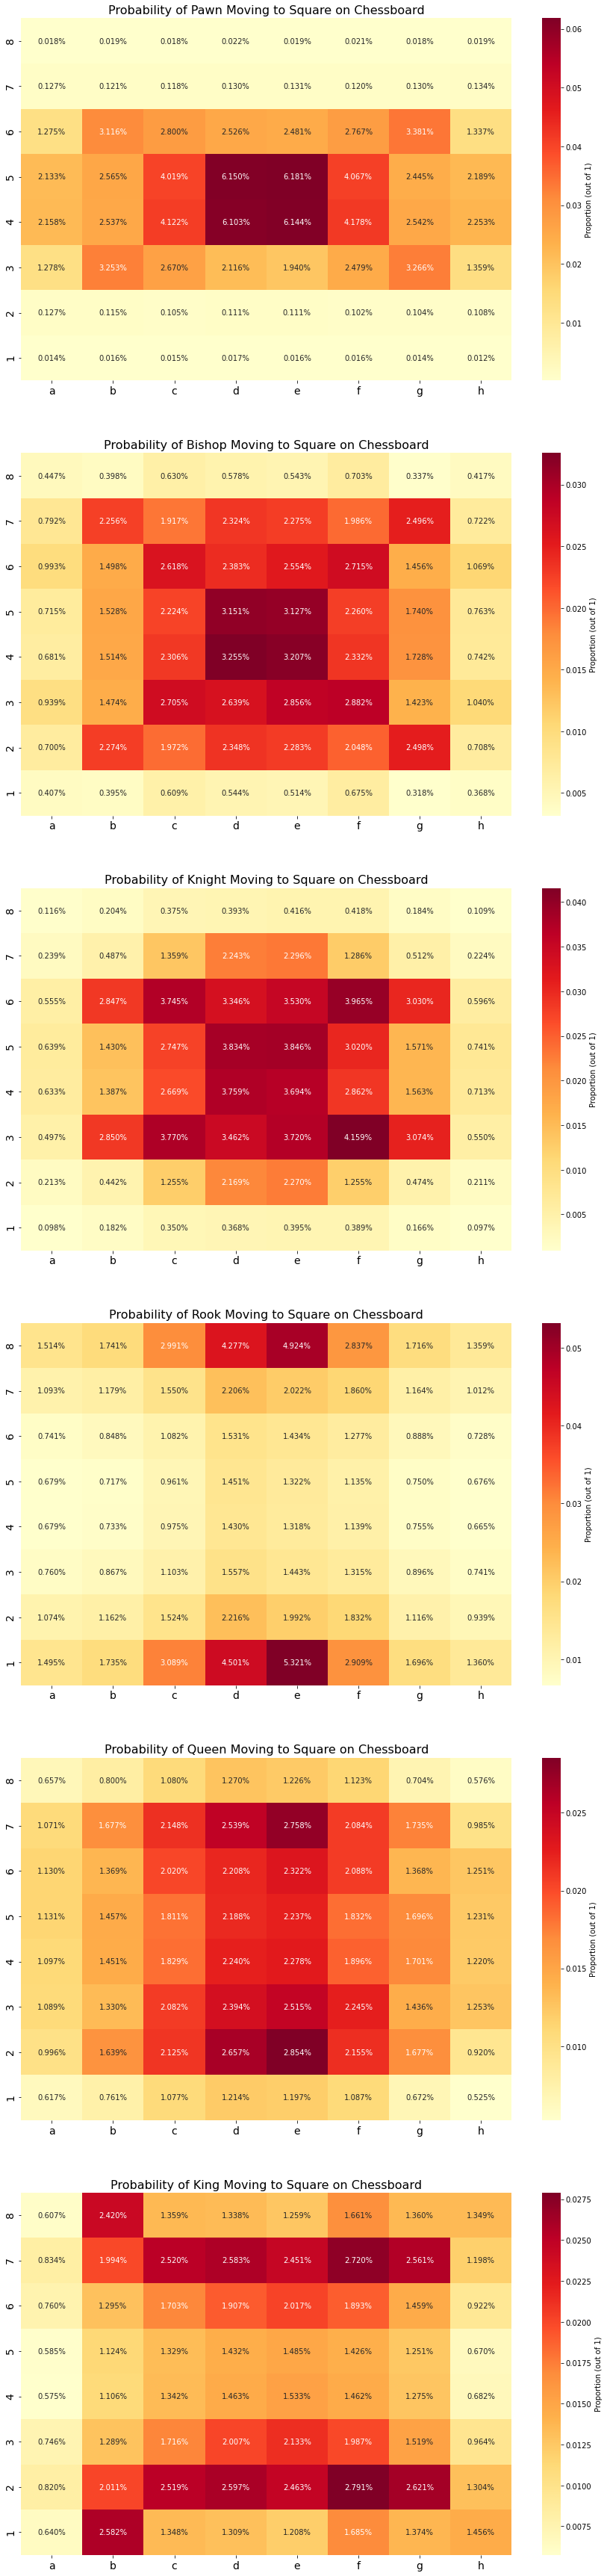
To visualize aspects of the chess variation chess960/Fischer Random, primarily: move tendencies varying by initial piece placement and where takes occur by piece. The finished product for games played in March 2021 is shown below. To take things further it would be a good iead to analyze a larger number of games, from a longer period of time. 336,189 games were played in March 2021, and therefore also analyzed. This large sample size is most likely sufficient, but further testing is needed to confirm this.
A documented report, comparing the results to heatmaps for the regular chess variant, is coming - along with more detailed further research, challanges and methods.
From the Jupyter notebook "Chess-Visulization-And-Analysis": Creating a heatmap visualizing the move tendencies requires us to, for every move in every game, count its' occurence. Generally, Python Pandas was used to handle the data and the games were parsed and intepreted using the python-chess library.
The function outputting the image was written by Evan Zhang, and is here used in the final step of the project.
 .
.