A simple Python data-structure visualization tool for Lists Of Lists, lists, dictionaries, and linked lists; primarily for use in Jupyter notebooks / presentations. It seems that I'm always trying to describe how data is laid out in memory to students. There are really great data structure visualization tools but I wanted something I could use directly via Python in Jupyter notebooks. The look and idea was inspired by the awesome Python tutor.
There are currently four functions of interest that return graphviz.files.Source objects:
dictviz(): A dictionary visualization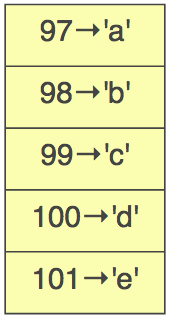
listviz(): Horizontal list visualization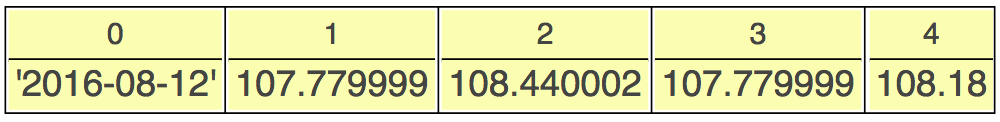
lolviz(): List of lists visualization with the first list vertical and the nested lists horizontal.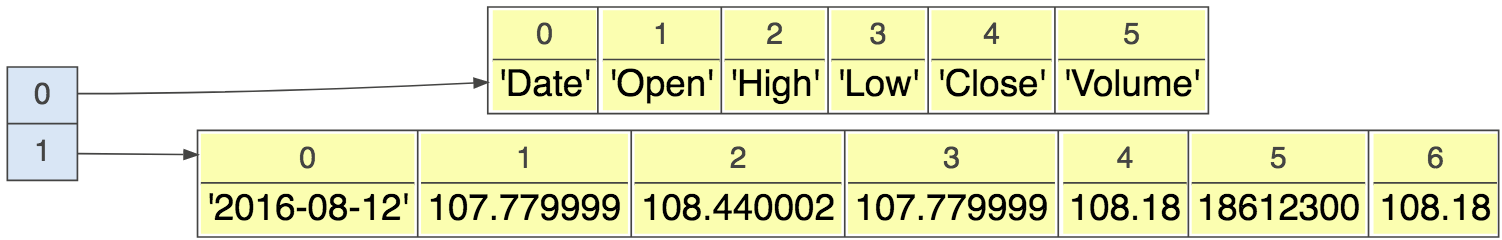
llistviz(): Linked list visualization with horizontal orientation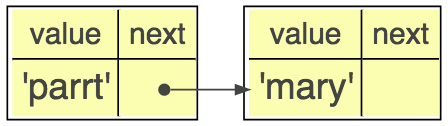


$ pip install lolvizFrom within generic Python, you can get a window to pop up using the render() method:
from lolviz import *
g = listviz(['hi','mom',{3,4},{"parrt":"user"}])
g.render(view=True) # render graphviz.files.Source object
From within Jupyter notebooks you can avoid the render() call because Jupyter knows how to display graphviz.files.Source objects:

You can look at a list of tuples as a list of list too:

Here's how to describe a hashtable with 3 elements in 2 different buckets:

If you want the graphviz/dot source, use source field of returned graphviz.files.Source object.
For 1.1, I added linked lists. Figuring out that layout was annoying. You're welcome. ;)

Here's an example of specifying lambda functions to extract values from nodes:
