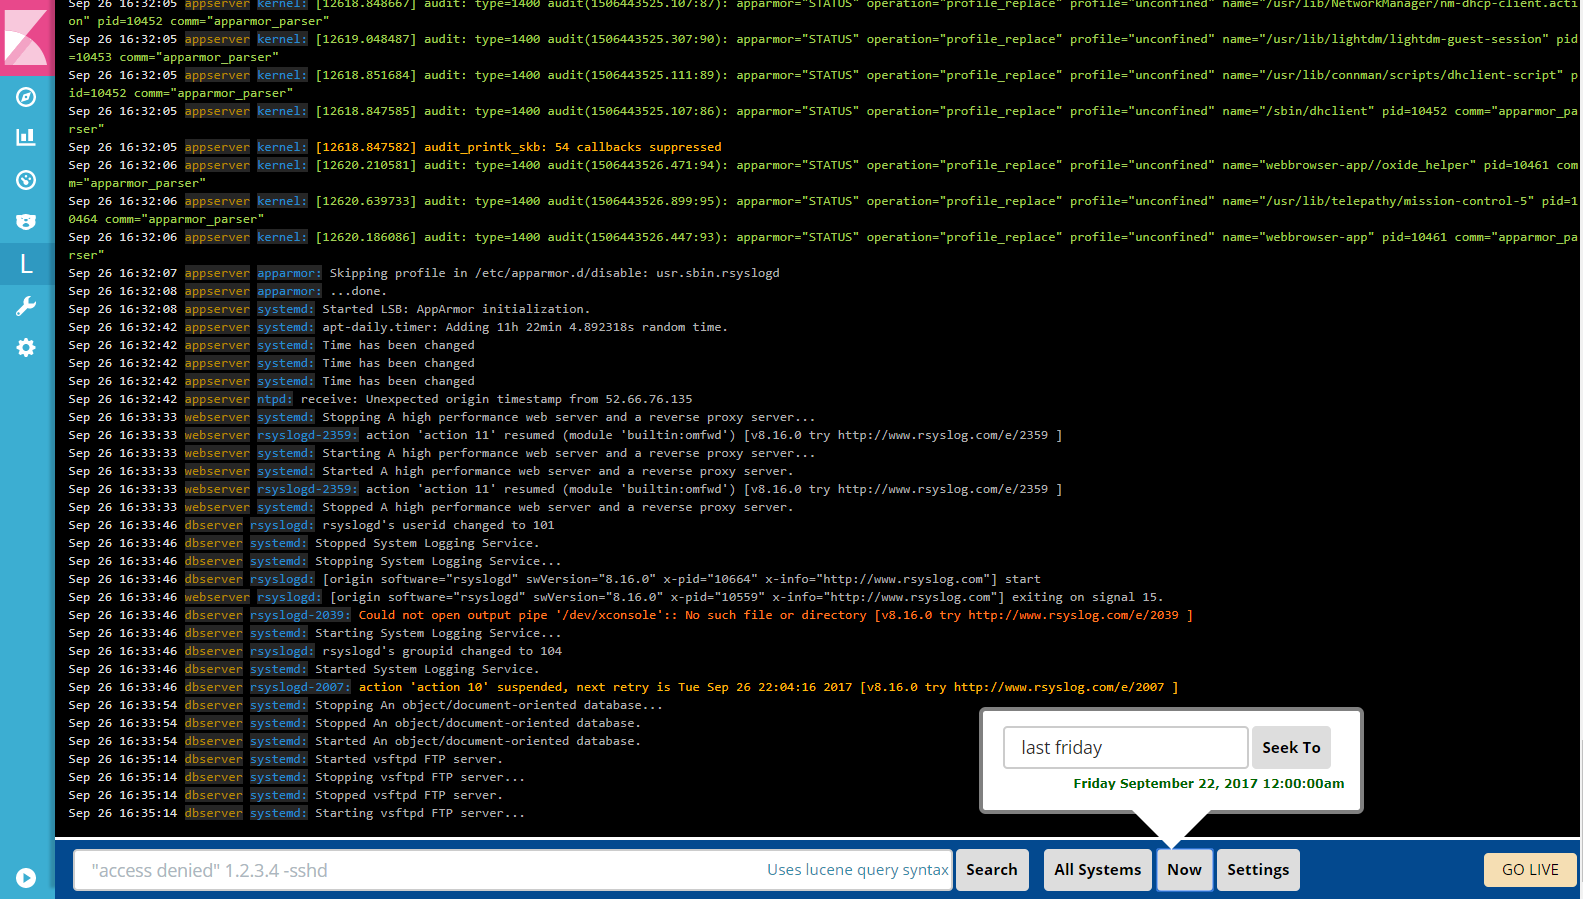
LogTrail is a plugin for Kibana to view, analyze, search and tail log events from multiple hosts in realtime with devops friendly interface inspired by Papertrail.
- View, analyze and search log events from a centralized interface
- Clean & simple devops friendly interface
- Live tail
- Filter aggregated logs by hosts and program
- Quickly seek to logs based on time
- Supports highlighting of search matches
- Supports multiple Elasticsearch index patterns each with different schemas
- Can be extended by adding additional fields to log event
- Color coding of messages based on field values
- Prerequisites
- Download and install Elasticsearch and Kibana
- Logtrail is supported and tested with Kibana 6.x and 5.x
- Install logtrail plugin (requires restart of Kibana after install)
- Kibana 7.4.1 :
./bin/kibana-plugin install https://github.com/sivasamyk/logtrail/releases/download/v0.1.31/logtrail-7.4.1-0.1.31.zip - Kibana 5.6.5 :
./bin/kibana-plugin install https://github.com/sivasamyk/logtrail/releases/download/v0.1.23/logtrail-5.7.4.1.1.23.zip - Other versions : https://github.com/sivasamyk/logtrail/releases
- Kibana 7.4.1 :
- Kibana requires exact match of plugin version to the Kibana version. If you can't find logtrail plugin release for a Kibana release, follow the instrcutions here to update Kibana version in your logtrail plugin archive.
- Refer Logtrail Config Examples Repo for sample configurations for syslog, Java app, Kubernetes logs.
- Logtrail can be configured by editing following fields present in
logtrail.jsonfile located inside./plugins/logtraildirectory. default_index- Elasticsearch index where the syslog events are stored (default: logstash-*)default_time_range_in_days- Default time range in days to search when time is not specified using Seek button. Example: Value of 30 means logtrail will search only in logs from last 30 days, unless time is specified using Seek button. Value of 0 means logtrail will search in all available logs by default.display_timezone- Timezone to display the timestamp in Event Viewer. e.g.America/Los_Angeles. Default value oflocalwill use the timezone of browser. The time specified inSeek Topopup will always use browser timezone.display_timestamp_format- Format to display the timestamp in Event Viewer. For list of valid value refer heredefault_search- if specified, this will applied as default search text while launching logtrail. The value can be any search text. e.g.ssh- shows all logs withsshin message field. orlog_level:SEVERE- shows all logs wherelog_levelfield isSEVERE. The field name should be a valid field in elasticsearch document. The default search field is the field mapped tomessage.fields- Edit this parameter to map the event fields in ES to logtrail fieldstimestamp- maps to @timestamp field inserted by logstash. This will be used for querying internally. Logtrail recommends @timestamp to be stored in UTC in ES.hostname- hostname from where the events were received. Also used by hostname filter. Hostname field should be of type keyword. For more info checkout Hostname field need to be of type keywordprogram- program that generated this event.message- actual event message. This field will be used by search.
- Example: If the event fields names are @timestamp, host, process, message the mapping should be
"mapping" : {
        "timestamp" : "@timestamp",
        "hostname" : "host",
        "program": "process",
        "message": "message"
}- By default each line displayed in the events view is of format:
display_timestamp hostname program:message message_format- Used to add additional fields to be shown for log event. For more details refer Adding additional fieldskeyword_suffix- Specifies the keyword suffix to be appended for hostname & program fields. Set it to""to not append any suffix. If not specified (undefined) logtrail will appendkeyword.color_mapping- Color code messages based on field values. For more details refer Color coding messages- Any changes in
logtrail.jsonrequires restart of Kibana - Logtrail can read
logtrail.jsonconfiguration from Elasticsearch instead of filesystem. This will be useful when sharing same configuration across multiple installations. For more info refer Load Logtrail configuration from Elasticsearch - Refer logtrail-config-examples repo for sample configurations
- Logs & Events from Windows, Java, Python, PHP, Perl, Ruby, Android, Docker, .Net can be shipped using syslog protocol.
- For more configuration options refer to Papertrail Configuration Help.
- Beats/Fluentd can also be used to ship events to ES and fields can be mapped using
fieldsparameter inlogtrail.json


