
Develop a C++ program that uses:
- File input
- Makefiles and modular design
- Dynamic array allocation/management
- Basic statistical calculations
- ZyBook chapters 1-9
- Canvas Arrays and Pointers page
Parsing data from databases and flat files (such as comma-delimited files - csv) is universally important in our modern world. The ability to take a raw data set and store the data for queries through a front end application is what drives many business, personal, and academic decisions.
Statistics is a complex sub-field of mathematics that boils down to trying to find important trends, correlations, and outlying data to garner insight into the ever-growing complexity of our digital world. In this project, we'll keep it simple and use only statistical functions you are already familiar with (well maybe one that you are not familiar with).
The average, denoted μ, of a data set is usually referred to as the mean of the data.
For a data set 1, 3, 3, 5, 6, the mean of that set is the sum of all the data divided by the number of data points.
e.g.
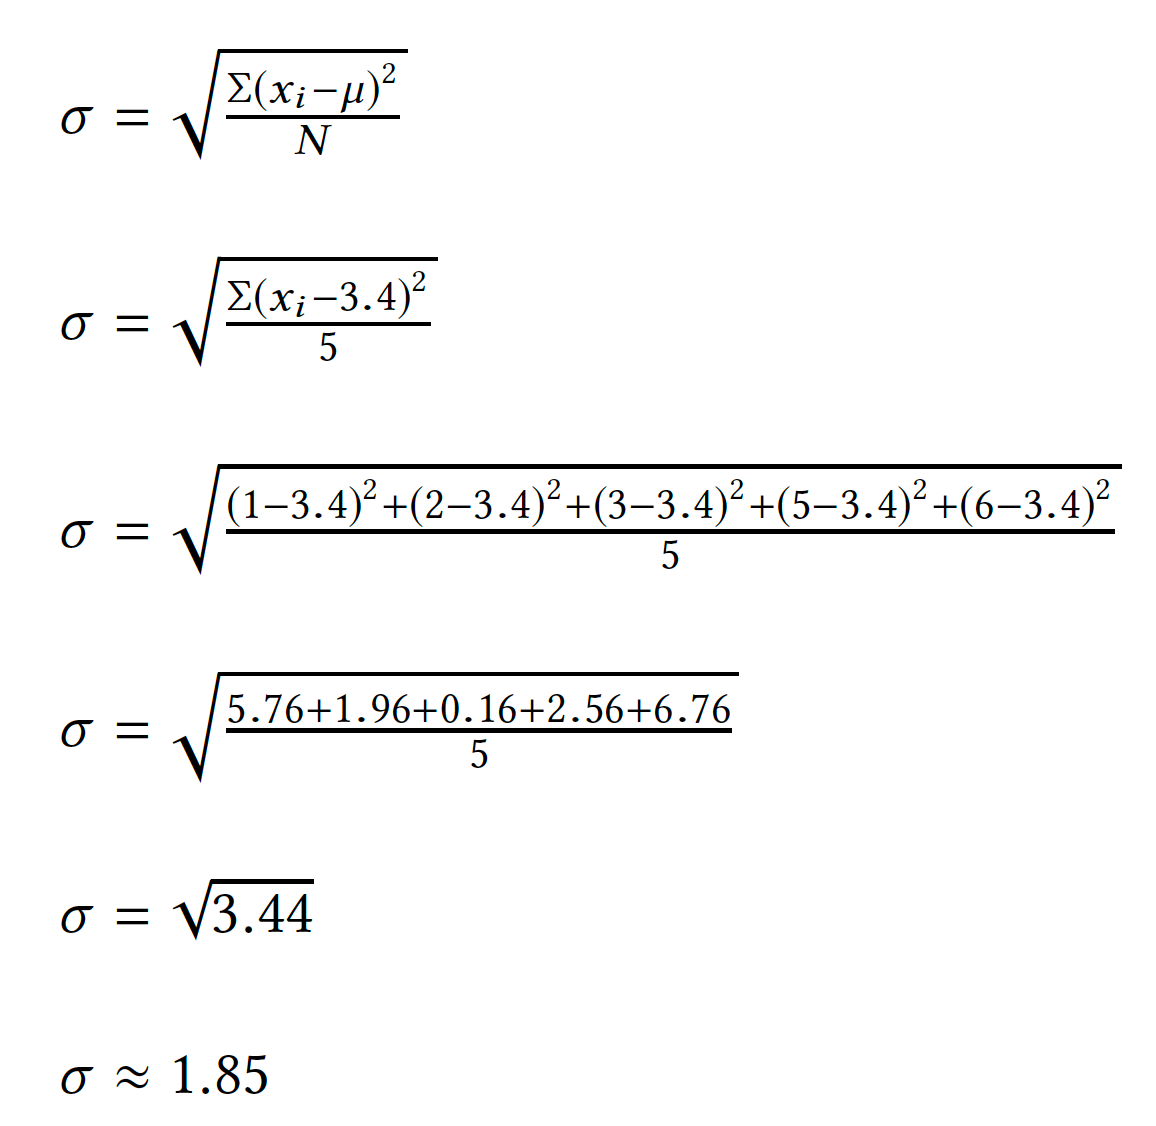
Standard deviation, often denoted σ is calculated as follows:
N is the number of data points in the set (referred to in statistics as a population).
So, for the sample data set 1, 2, 3, 5, 6, the mean calculated above is 3.4. Plugging in for σ, we'd get
The importance of the standard deviation is that any data more than two standard deviations from the mean is considered statistically significant and is referred to as an outlier. As such, it can be used to identify data that was improperly measured, or is otherwise unexpected.
We'll be using the above functions on a set of input data to help identify unusual morbidity data reports broken out by state. The data from the CDC was sourced here https://data.cdc.gov/NCHS/Weekly-Counts-of-Deaths-by-State-and-Select-Causes/muzy-jte6 and here https://data.cdc.gov/NCHS/Weekly-Counts-of-Deaths-by-State-and-Select-Causes/3yf8-kanr.
Your application must function as described below:
- In order to ensure that your statistical calculations are correct, your program must pass all of the given tests in the
*.cppfiles in the test directory, e.g. test/test-stats.cpp.- The test suites are:
- test-week-object - This tests the object used to store the data for a given week.
- test-stats - This tests the static methods needed to do the necessary calculations.
- test-state-object - This tests the object used to store the data for a given state.
- test-morbidity - This tests your file reading functions and is essentially an integration test. Once it is running, you are ready to build the main program (which should at that point be rather trivial).
- Running all of these tests must be possible by running
make test-all.
- The test suites are:
- Building an executable called main must be possible by running
make main. - Running the main program should prompt a user for the input file name.
- If the input file is not present, Unable to read input file should be displayed to the user and they should be prompted again to enter a file name.
- Once the file has been loaded, your program should offer the ability to query for the following things:
- All-time average (mean) for a given state.
- List of weeks that are statistical outliers for a given state.
- List all states and their respective number of statistically significant (more than two standard deviations from the mean) weeks.
- Your project will lose points if memory leaks exist.
The data will be in the following format. For this project, it is safe assume the data is properly formatted, that is exactly 3 columns will be present in each row of data.
State,Week Ending Date,All Cause
Florida,2014-01-04,2101
Florida,2014-01-11,3877
Florida,2014-01-18,3800
Welcome to the somber data viewer. Enter the file name with the morbidity data: foo.bar
Unable to read input file!
Enter the file name with the morbidity data: data.csv
	1 - Output the mean for a state
	2 - Get a list of outliers for a state
	3 - List all states with statistically significant data points
	anything other than 1-3 will end the application.
Please choose an option from the above menu: 1
Enter the name of the state to search: Texas
-------------------------
The mean deaths for Texas is 4000.91
-------------------------
	1 - Output the mean for a state
	2 - Get a list of outliers for a state
	3 - List all states with statistically significant data points
	anything other than 1-3 will end the application.
Please choose an option from the above menu: 2
Enter the name of the state to search: North Carolina
-------------------------
Statistical outliers for North Carolina
	2020-12-19 - total deaths: 2588
	2020-12-26 - total deaths: 2670
	2021-01-02 - total deaths: 2837
	... Sample output truncated for brevity
	2021-07-24 - total deaths: 495
	2021-07-31 - total deaths: 434
	2021-08-07 - total deaths: 319
-------------------------

	1 - Output the mean for a state
	2 - Get a list of outliers for a state
	3 - List all states with statistically significant data points
	anything other than 1-3 will end the application.
Please choose an option from the above menu: 3
-------------------------
	Alabama: 16 outlying weeks
	Alaska: 18 outlying weeks
	... Sample output truncated for brevity
	Wisconsin: 14 outlying weeks
	Wyoming: 18 outlying weeks
-------------------------
	1 - Output the mean for a state
	2 - Get a list of outliers for a state
	3 - List all states with statistically significant data points
	anything other than 1-3 will end the application.
Please choose an option from the above menu: 9999- Create a project that is object oriented, therefore there should be several classes.
- The input file will match the exact format given above.
- Ensure that
make test-allpasses all test assertions, otherwise you will not get full credit. - Don't forget to build main.cpp, it too is required for full credit.
Below is the UML of a possible solution to this project


- All code must be added and committed to your local git repository.
- All code must be pushed to the GitHub repository created when you "accepted" the assignment.
- After pushing, with
git push origin main, visit the web URL of your repository to verify that your code is there. If you don't see the code there, then we can't see it either.
- After pushing, with
- Your code must compile and run. The auto-grading tests will indicate your score for your submission.
- The auto-grading build should begin automatically when you push your code to GitHub.
- If your program will not compile, the graders will not be responsible for trying to test it.
- You should get an email regarding the status of your build, if it does not pass, keep trying.
- Projects will be graded on whether they correctly solve the problem, and whether they adhere to good programming practices.
- Projects must be received by the time specified on the due date. Projects received after that time will get a grade of zero.
- Please review the academic honesty policy.
- Note that viewing another student's solution, whether in whole or in part, is considered academic dishonesty.
- Also note that submitting code obtained through the Internet or other sources, whether in whole or in part, is considered academic dishonesty.
- All programs submitted will be reviewed for evidence of academic dishonesty, and all violations will be handled accordingly.
- View on GitHub:
- On your GitHub repo page, Click the
▶️ Actions tab to see your graded results. - If it isn't a green check mark (:heavy_check_mark:) then at least part of the testing failed.
- Click the commit message for the failing version then click "Autograding" on the left side of the page.
- Follow the ❌ path and expand things to see what errors exist.
- At the bottom of the education/autograding section, you can view the score for the auto-grading portion of the rubric. It will look something like 40/90.
- On your GitHub repo page, Click the