R things that are hot right now
to do r things to keep in mind
To sort:
Cool r commands :
use count() using the sort and wt entries.
add_count() instead of group_by/mutate/ungroup
summarize(x = list())
mutate(thingie = fct_reorder(column, function)
geom_col+coord_flip (to deal w/ pesky labels
flow::flow_view() on a function, a quoted expression, or the path of an R script to visualize it.
flow::flow_run() on a call to a function to visualize which logical path in the code was taken. Set browse = TRUE to debug your function block by block (similar to base::browser()) as the diagram updates.
janitor::clean_names to clean df column names when imported by a silly method.
dplyr::slice_max to get the top n entries of a df (according to a certain field)
asdf
combine `crossing` with `augment` especially augment(data_that_has_been_crossed, type.predict = "response")
To do Net Promoter Score or other marketting stuff: https://cran.r-project.org/web/packages/marketr/vignettes/introduction_to_marketer.html

To send better bash scripts (to talk to the console): https://www.rdocumentation.org/packages/base/versions/3.6.2/topics/shQuote
mtcars %>% select(1,2,3) %>%
purrr::by_row(sum, .collate = "cols", .to = "BOOM")

Cool correlation Chart: PerformanceAnalytics::chart.Correlation(iris[-5],pch=21)

https://prodi.gy/ - a tool that helps create labels for data, and learns while it's going.
How it all started:
How I used R to create a word cloud, step by step | Georeferenced
Concept / meta
Startup
Complicated startup sequence: https://rstats.wtf/images/R-startup.svg
Efficiency
Tips
4 ways to be more productive, using RStudio's terminal - Jozef's Rblog
https://speakerdeck.com/jennybc/how-to-name-files - How to name fil.....
Teaching
swcarpentry/r-novice-gapminder: Introduction to R for non-programmers using gapminder data.
https://education.rstudio.com/learn/
master-the-tidyverse/01-Visualize-Data.Rmd at master · rstudio/master-the-tidyverse
Learning to Teach Machines to Learn | Alison Hill
To create exams: http://www.r-exams.org/tutorials/
To create dummy data/fake PII data for examples: https://github.com/paulhendricks/generator or https://github.com/trinker/wakefield
Blogs
R in Business Intelligence – Jan Gorecki – blog
## EDA ## Explore Your Dataset in R — Little Miss Data
Principles
t-test and how big sample group - Alexa and Accented English
omg, binder! - the stupidest thing...
Debugging
Debugging in R: How to Easily and Efficiently Conquer Errors in Your Code
to view errors smarter: recover() ( https://www.inwt-statistics.com/read-blog/debugging-in-r.html)
proffer v0.0.2: Builds on pprof to provide profiling tools capable of detecting sources of slowness in R code. Look here for more information.
Convenience:
http://dirk.eddelbuettel.com/code/anytime.html automatically detect date format from ANY string
funneljoin v0.1.0: Implements a time-based joins to analyze sequence of events, both in memory and out of memory. See the vignette for details.
biglmm v0.9-1: Provides regression for data too large to fit in memory. This package functions exactly like the biglm package, but works with later versions of R.
dbx v0.2.1: Provides select, insert, update, upsert, and delete database operations for PostgreSQL, MySQL, SQLite, and other databases. See the README for usage
metaDigitise v1.0.0: Provides functions to extract, summarize and digitize data from published figures in research papers. The vignette shows how to use the package. Printed Plot
visdat - vis_guess() guesses the type of each field
naniar::vis_miss - to visualize missing fields
Automation/pipeline
targets (ex Drake) - Let's you set up a pipeline of steps, including a .sh file and network analysis!
callr - for controller scripts that source in many things, this keeps each call in its own environment
docker - Talk about deploying Docker & Kubernettes
Obtaining, Cleaning & Processing
DataOps
Scheduling R Tasks via Windows Task Scheduler | TRinker's R Blog
Twitter analysis using R (Semantic analysis of French elections)
Google Vision API in R with RoogleVision | Stoltzmaniac
How to make your machine learning model available as an API with the plumber package
Securing a dockerized plumber API with SSL and Basic Authentication | QUNIS
Scraping
Pirating Web Content Responsibly With R | rud.is
ORiley book on Mining social networks TOC - github
Analysis
General
MultiFit v0.1.2: Provides functions to test for independence of two random vectors and learn and report the dependency structure. For more information, see Gorsky and Ma (2018) and the vignette. Like correlation?
Compare data.frames: compareDF::compare_df() and then to visualize, compareDF::create_output_table
To categorize numeric variable:
In ggplot2:
- cut_number(): Makes n groups with (approximately) equal numbers of observation
- cut_interval(): Makes n groups with equal range
- cut_width: Makes groups of width width
Recommendation systems:
- https://blog.datasciencedojo.com/movie-recommender-systems/
- https://cran.r-project.org/web/packages/recosystem/vignettes/introduction.html
Analyze satellite imagery:
https://www.youtube.com/watch?v=k1K6nqgtRL8
Causal inference:
https://deepmind.com/blog/article/Causal_Bayesian_Networks
SNA/network
Good tutorial: https://www.mr.schochastics.net/material/netVizR
Drag and drop, collapsible d3.js Tree with 50,000 nodes - bl.ocks.org
Collapsible Force Layout - bl.ocks.org
Summary of community detection algorithms in igraph 0.6 | R-bloggers
RPubs - Network Visualization Tutorial 2015
Good book: https://www.cs.cornell.edu/home/kleinber/networks-book/networks-book-ch03.pdf
The mother of all packages: https://igraph.org/
Best way to visualize: https://datastorm-open.github.io/visNetwork/
(for big networks, use: visNetwork::visPhysics(stabilization = FALSE) %>% visNetwork::visIgraphLayout() )
to calculate bridges: https://cran.r-project.org/web/packages/networktools/networktools.pdf
tidy manipulation of SNA data: https://www.data-imaginist.com/2017/introducing-tidygraph/
to plot geo networks: https://ggobi.github.io/ggally/#ggallyggnetworkmap
To draw cool networks: http://blog.schochastics.net/post/sketchy-hand-drawn-like-networks-in-r/
ORiley list of Graph theory resources
To filter SNAs: MultiScale Algorithm,
SNA examples:
Recipie recommendation using ingredient networks
Mapping Reddit using backbone and cluster
More datasets and some convenience functions - http://blog.schochastics.net/post/extending-network-analysis-in-r-with-netutils/
Visualise network in a more simplified way: https://blog.revolutionanalytics.com/2015/08/contracting\-and\-simplifying\-a\-network\-graph.html
NLP / Sentiment Analysis
Extracting basic Plots from Novels: Dracula is a Man in a Hole – Learning Machines
NLPclient v1.0: Implements an interface to the Stanford CoreNLP annotation client which includes a part-of-speech (POS) tagger, a named entity recognizer (NER), a parser, and a co-reference resolution system.
sentimentr - Sentiment analysis including negation
udpipe - break down text analysis into 4 parts: 'tokenization', 'parts of speech tagging', 'lemmatization' and 'dependency parsing'
quanteda - for viz
textclean - for cleaning text (including replace_emoticon(), check_text() )
Emojis Analysis in R | R-bloggers
400+ Sarcastic Quotes, Sarcasm Sayings - CoolNSmart
bfelbo/DeepMoji: State-of-the-art deep learning model for analyzing sentiment, emotion, sarcasm etc.
MonkeyLearn - Natural Language Processing
Emoji data science in R: A tutorial – PRISMOJI
Automated Text Feature Engineering using textfeatures in R | DataScience+
NLP's ImageNet moment has arrived
https://bookdown.org/max/FES/text-data.html#text-data - How to check the keywords relevant to one class in a multi-class problem.
Topic modelling
Automated Topic Discovery: An Approachable Explanation
Topic modeling made just simple enough. | The Stone and the Shell
Julia Silge - Training, evaluating, and interpreting topic models
Semi-supervised topic modelling - CorEx
[textrank�(https://cran.r-project.org/web/packages/textrank/vignettes/textrank.html) - To find the most relevant sentences in a topic
For fuzzy matching names, think about using Initials in order to avoid some problems. Tom/Thomas/Tommy --> T
To visualize topics: https://github.com/cpsievert/LDAvis
another option: https://www.rtextminer.com/articles/a_start_here.html#why-textminer
Qual
Discourse Network Analysis: Undertaking Literature Reviews in R
A very brief introduction to species distribution models in R
rOpenSci | Working with audio in R using av
Exploring correlations in R with corrr
AutoEDA stuff:
BESTTT: DataExplorer DataExplorer::create_report(df)
Good blog article: https://www.groundai.com/project/the-landscape-of-r-packages-for-automated-exploratory-data-analysis/1
ggpairs - https://ggobi.github.io/ggally/#columns_and_mapping
to view summary data: skimr::skimr
SmartEDA - several things, but especially the Parallel Coordinate Plots
modelling & ML
General
Structural Equation Modeling with lavaan in R (article) - DataCamp
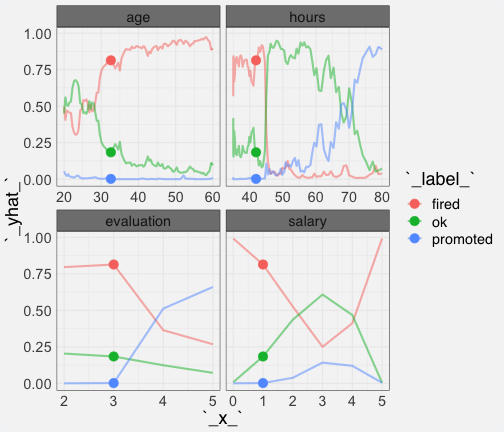
https://pbiecek.github.io/ceterisParibus/ - present model responses around a single point in the feature space. For example around a single prediction for an interesting observation. Plots are designed to work in a model-agnostic fashion, they are working for any Machine Learning model and allow for model comparisons. Can do what if, single and multiple classification, regression, a bunch of stuff.
Best Subsets Regression - to figure out the best model varying the components: http://www.sthda.com/english/articles/37-model-selection-essentials-in-r/155-best-subsets-regression-essentials-in-r/#:~:text=The%20R%20function%20regsubsets(),to%20incorporate%20in%20the%20model.&text=The%20function%20summary()%20reports,variables%20for%20each%20model%20size.
NeuralNetwork
How to create a sequential model in Keras for R
Modelling
Missing Value Treatment | DataScience+
Utah Water Time-series and anomaly detection
Handling missing data with MICE package; a simple approach | DataScience+
Graphically analyzing variable interactions in R | R-bloggers
Feature Selection using Genetic Algorithms in R
Machine Learning
Unsupervised
Quick and easy t-SNE analysis in R – intobioinformatics
Machine Learning vs. Statistics | Open Data Science
Practical Machine Learning Problems - Machine Learning Mastery
Random forest in parallel example
Imputing Missing Data with R; MICE package | DataScience+
Slides from my talk on the broom package – Variance Explained
What are the Best Machine Learning Packages in R? | R-bloggers
Does money buy happiness after all? Machine Learning with One Rule
How to Identify the Most Important Predictor Variables in Regression Models | Minitab
Web Scraping and Applied Clustering Global Happiness and Social Progress Index | DataScience+
Explaining complex machine learning models with LIME
IMDB Genre Classification using Deep Learning – Florian Teschner – YaDS (Yet another Data Scientist)
A guide to GPU-accelerated ship recognition in satellite imagery using Keras and R (part I)
GANs explained. Generative Adversarial Networks applied to Generating Images | Open Data Science
Dealing with unbalanced data in machine learning
MI2DataLab/modelDown: modelDown generates a website with HTML summaries for predictive models
Tuning xgboost in R: Part I | insightR
Hidden Technical Debt in Machine Learning Systems
Tell Me a Story: How to Generate Textual Explanations for Predictive Models – SmarterPoland.pl
When Cross-Validation is More Powerful than Regularization – Win-Vector Blog
Visualizing
General
https://www.data-to-viz.com/ - What viz should I use?
ggeasy - To make eeeeverything easy
To combine plots in one:
ggmatrix
https://ggobi.github.io/ggally/#ggallyggmatrix
To plot 2 different facet levels:
- https://ggobi.github.io/ggally/#strips_control
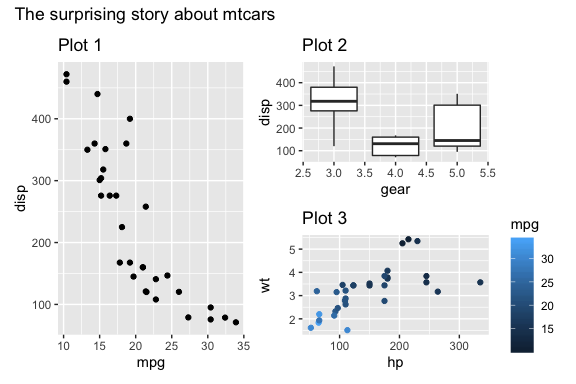
- patchwork v1.0.0: Extends the ggplot2 API to allow for arbitrarily complex plot compositions by providing mathematical operators for combining multiple plots. See the vignette for examples.
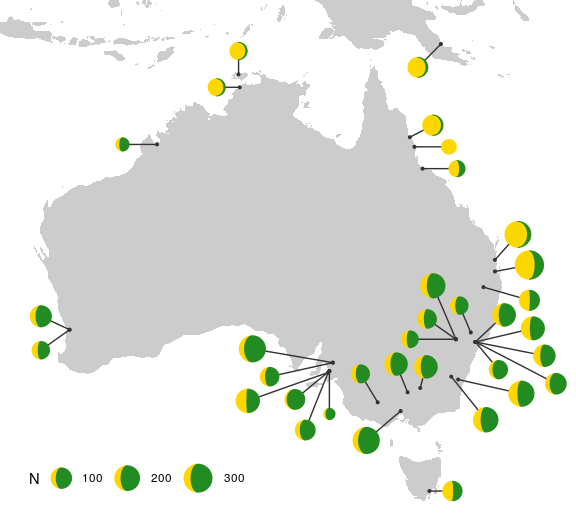
gggibbous v0.1.0: Extends ggplot2 to offer moon charts, pie charts where the proportions are shown as crescent or gibbous portions of a circle, like the lit and unlit portions of the moon. It i all illuminated in the vignette.
ggvoronoi v0.8.0: Provides functions to create, manipulate and visualize Voronoi diagrams using the deldir and ggplot2 packages. The vignette shows how.
To highlight areas of the plot:
ggalt (also to do additional shapes and functionalities)
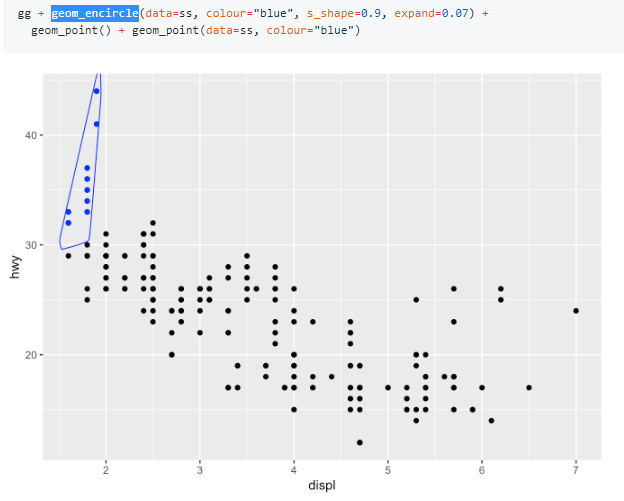
or
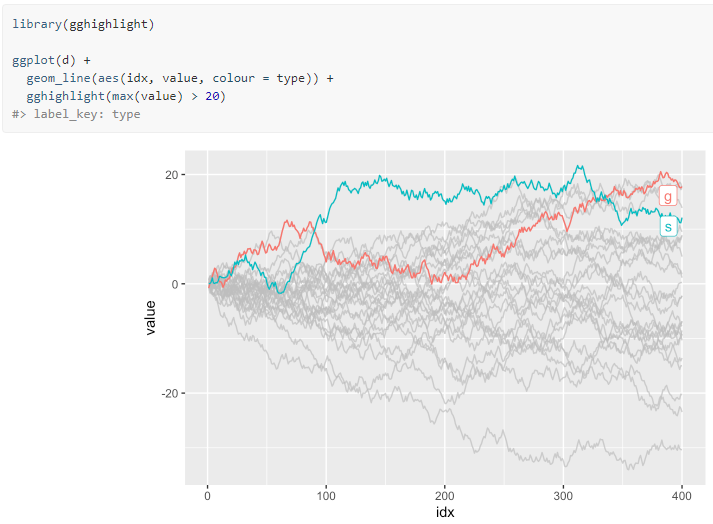
gghighlight: highlight certain series
3d Plots
https://github.com/bwlewis/rthreejs
https://symbolixau.github.io/mapdeck/articles/layers.html
Markdown
Options - Chunk options and package options - Yihui Xie | 谢益辉
https://github.com/trinker/numform - presenting numbers better (like percents, rounding etc... suitable for inclusion in report tables).
Viz
animint/references.org at master · tdhock/animint
candlestick chart - Animating googleVis plots in R - Stack Overflow
Better animation (interpolation for points to be used w/ gganimate- https://github.com/thomasp85/tweenr
R to D3 rendering tools • r2d3
nachocab/clickme interactive plots
Shiny
The R Shiny packages you need for your web apps! - Enhance Data Science
Discovery Dashboards | Engineering | Wikimedia Foundation
Discovery Dashboards | Engineering | Wikimedia Foundation
sortable v0.4.2: Provides functions to enables drag-and-drop behavior in Shiny apps, by exposing the functionality of the SortableJS JavaScript library as an htmlwidget. There is a live demo on Using Sortable and another on Using Sortable widgets, and a vignette on the Interface to SortableJS.
Package building
Deal with dependencies in package generation:
Unit/Integration Testing
Testing, testing, testing! | R-bloggers
The Travis CI Blog: What is CI - Testing and Deploying (Part 2)
Travis CI for R — Advanced guide – Towards Data Science
mocking using mockr and mockery: https://www.youtube.com/watch?v=iRFJ6f7ZhsQ
Topics
HR - Human Resources
Chapter 13 Gender Pay Gap | HR Analytics in R
Music
R-Music: Introduction to the chorrrds package
The Minor fall, the Major lift: inferring emotional valence of musical chords through lyrics
TileMaker/tile_maker.R at master · DataStrategist/TileMaker
Finance
Maps
How to highlight countries on a map - SHARP SIGHT LABS
Merging spatial buffers in R | Insights of a PhD
Is London a Forest? How to Use GIS and Open Data to Find Out
Unique IDs - PlayerIds · Robert Nguyen
Many examples: https://gitlab.com/dickoa/30daymapchallenge
Free geocoding! https://photon.ko
Instruction
Communicating with R Markdown Workshop | Alison Hill
Principles & Practice of Data Visualization
Getting LearnR tutorials to run on mybinder.org | Ted Laderas, PhD
DBM Express Order For Service - mexindian@gmail.com - Gmail
Data
General
climate v0.3.0: Provides access to meteorological and hydrological data from OGIMET, University of Wyoming - atmospheric vertical profiling data, and Polish Institute of Meteorology and Water Management - National Research Institute. There is a vignette.
CCAMLRGIS v3.0.1: Loads and creates spatial data, including layers and tools that are relevant to the activities of the Commission for the Conservation of Antarctic Marine Living Resources ( CCAMLR). Have a look at the vignette.
schrute v0.1.1: Contains the complete scripts from the American version of the Office television show in tibble format. Have a look at the vignette and practice NLP.
fredr v1.0.0: Provides an R client for the Federal Reserve Economic Data (FRED). There are vignettes on FRED Categories, Releases, Series, Sources, and Tags, as well as a Getting Started Guide.
jstor v0.3.2: Provides functions to import metadata, ngrams, and full-texts delivered by Data for Research by JSTOR. There is an Introduction, and vignettes on Automating File Import and Known Quirks. to analyze publications/papers
rLandsat v0.1.0: Provides functions to search and acquire Landsat data using an API built by Development Seed and the U.S. Geological Survey. See README for how to use the package.
weathercan v0.2.7: Provides tools for downloading historical weather data from the Environment and Climate Change Canada website. Data can be downloaded from multiple stations over large date ranges, and automatically processed into a single dataset. There is an Introduction, a Glossary, and vignettes on Flags and Interpolation.
Music lyrics: https://statnamara.wordpress.com/2021/01/26/scraping-analysing-and-visualising-lyrics-in-r/
NLP
Introducing the schrute Package: the Entire Transcripts From The Office · technistema
Film Corpus 2.0 | Natural Language and Dialogue Systems
Data strategy
Summary-Designed-Data-Maturity-Framework-Social-Sector-FINAL-v1.pdf
Crime
Accessing the Justice Data Lab service - GOV.UK
A large repository of networkdata · David Schoch
HDX Universe: The shape of the Humanitarian Data Exchange
From data to Viz | Find the graphic you need
Twitter Trending Hashtags and Topics - Trendsmap
Omdena | Building AI for Good Through Community Collaboration
Sovereign Environmental, Social, and Governance Data | World Bank
Global Marine Environment Datasets
