This analysis analyses New York City's Citi Bike to provide investors and key shareholders with insights on what the outcome of a bike-sharing program in Des Moines could look like.
Link to Public Tableau Dashboard
Left to right, Top to bottom.
- The older the person, the less likely the person is to take long trips.
- The Top Starting Locations are centred around the city center
Left to right, Top to bottom.
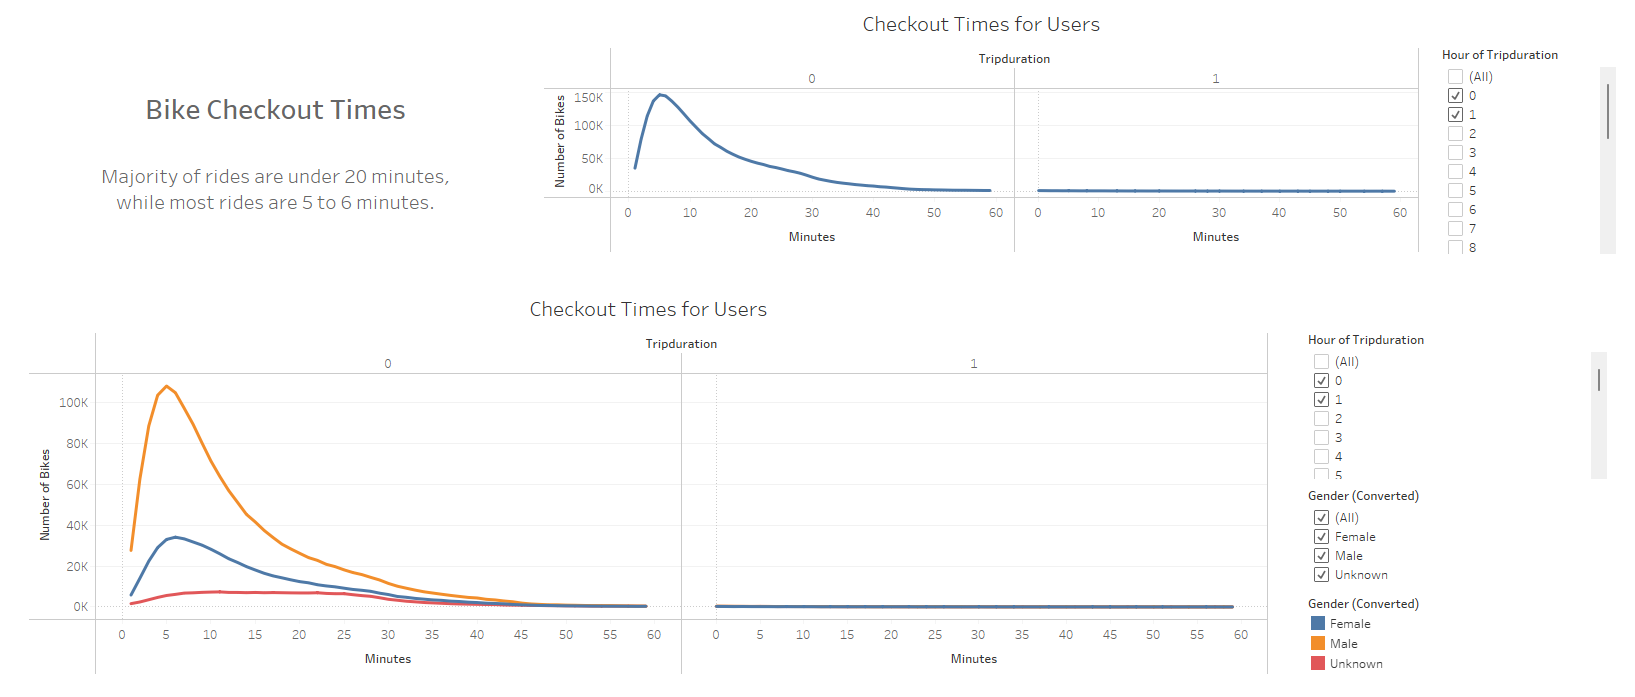
- Most rides are under 20 minutes
- Most rides are around 5-6 minutes
- Females are more likely to take long bike rides than men
Left to right, Top to bottom.
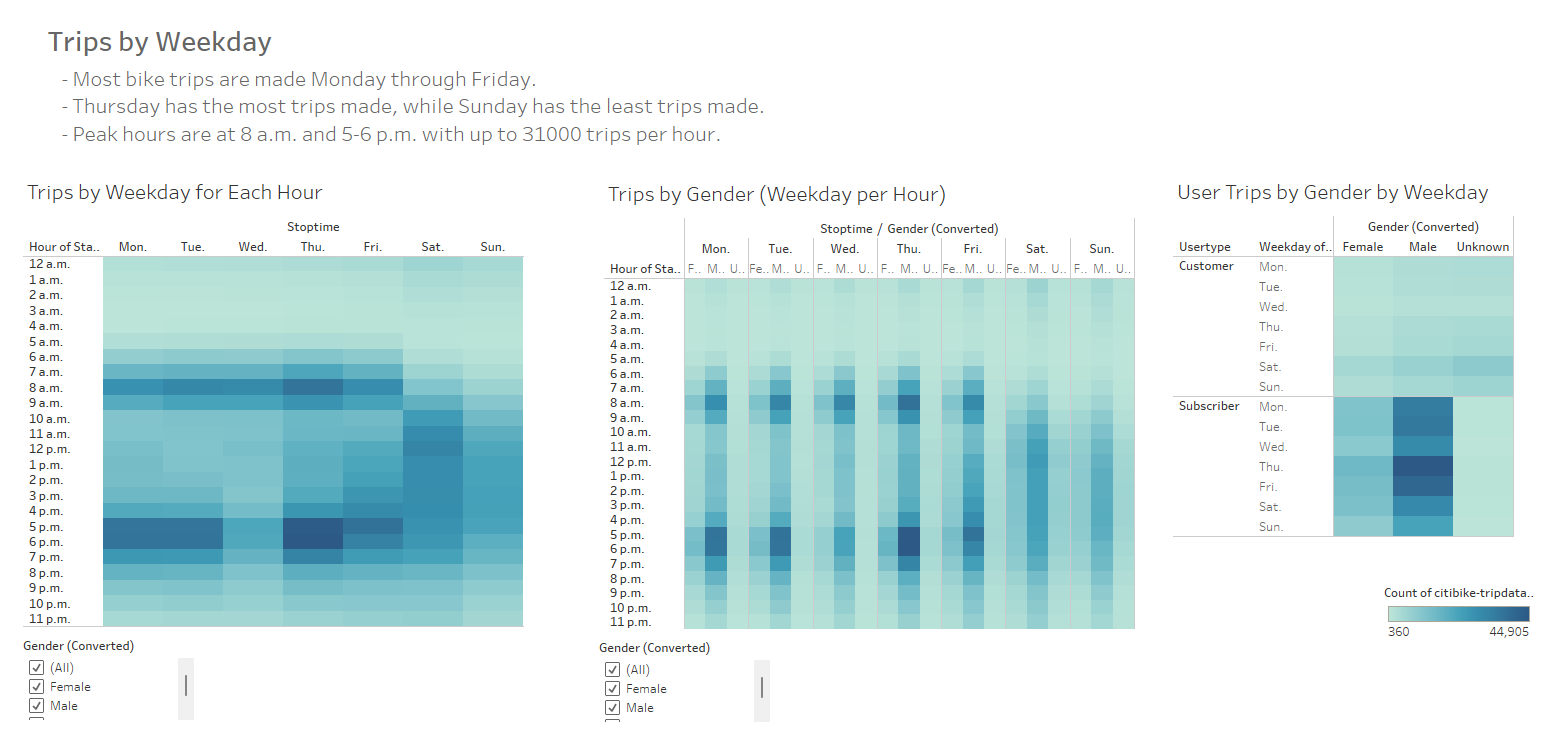
- Most bike trips are made Monday through Friday
- Thursday has the most trips made, while Sunday has the most minor trips made
- Peak hours are 8 a.m. and 5-6 p.m. with up to 31000 trips per hour
- Males make most bike trips
- Saturdays are the most common day for non-subscribers to travel
- Weekdays are the most popular days with up to 31000 trips per hour
- Most trips are 5-6 minutes long while most of them are under 20 minutes
- Males do most trips
- It would be good to display a visualization of what locations people bike to, not only from
- It would be interesting to factor in the usage and mileage of electric bikes vs normal bikes


