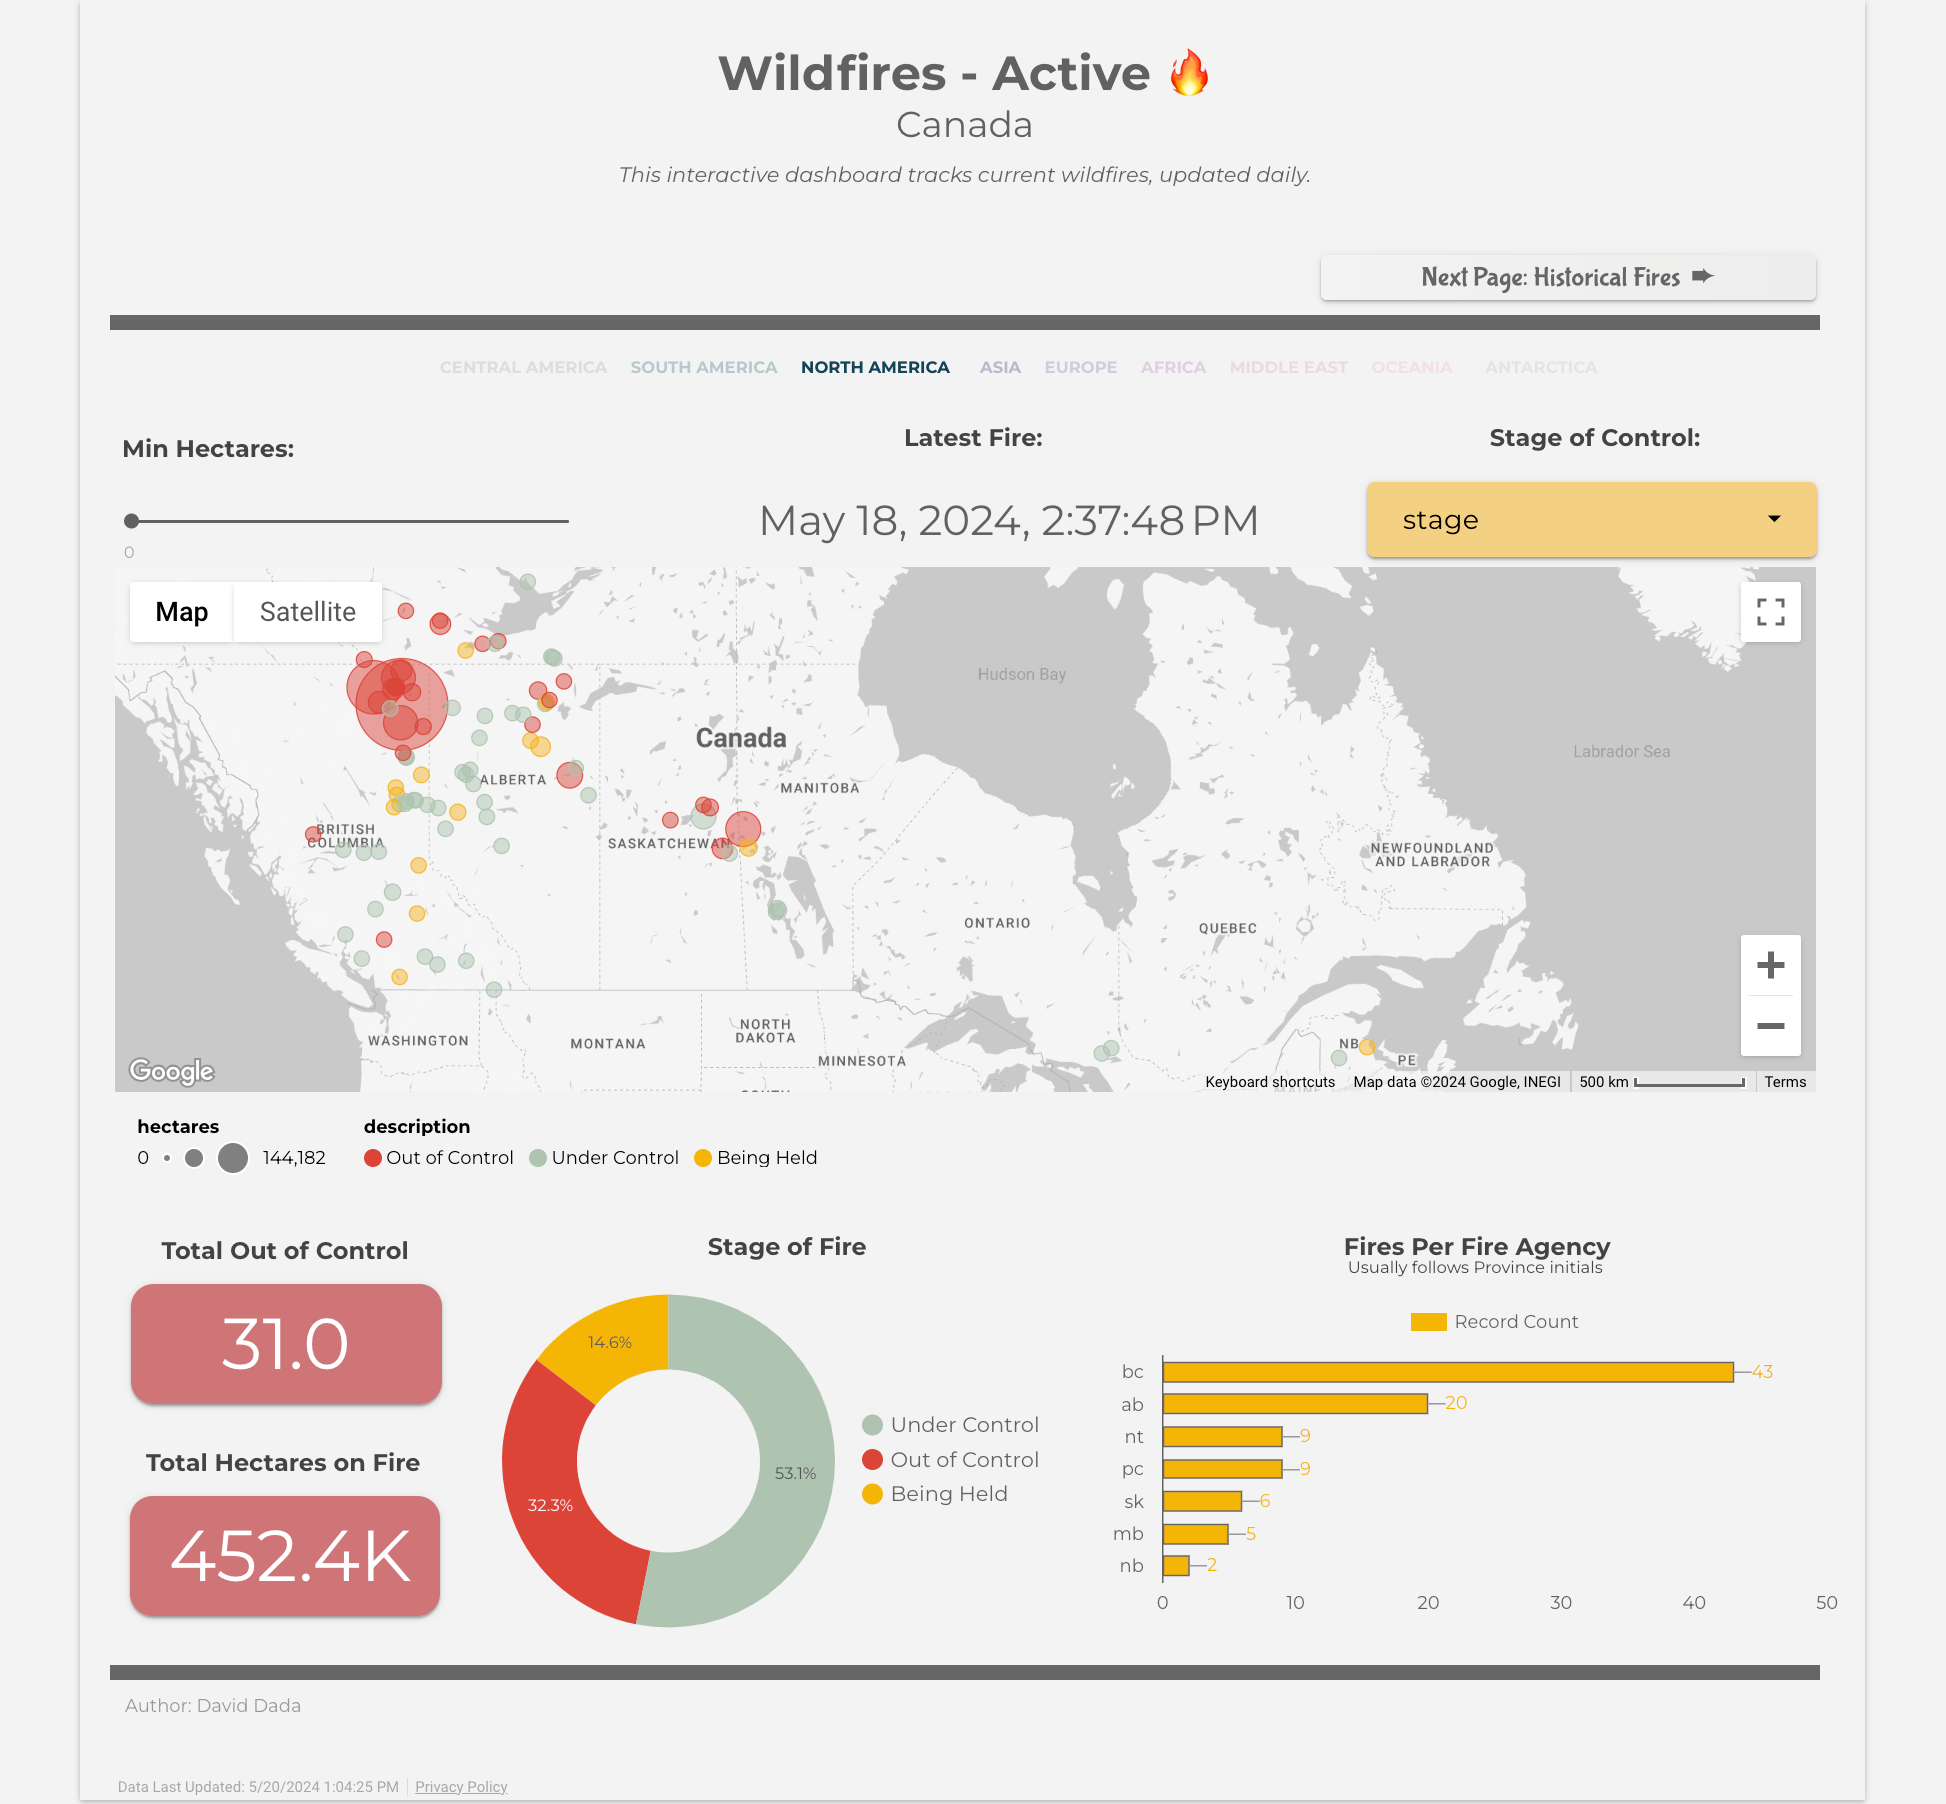
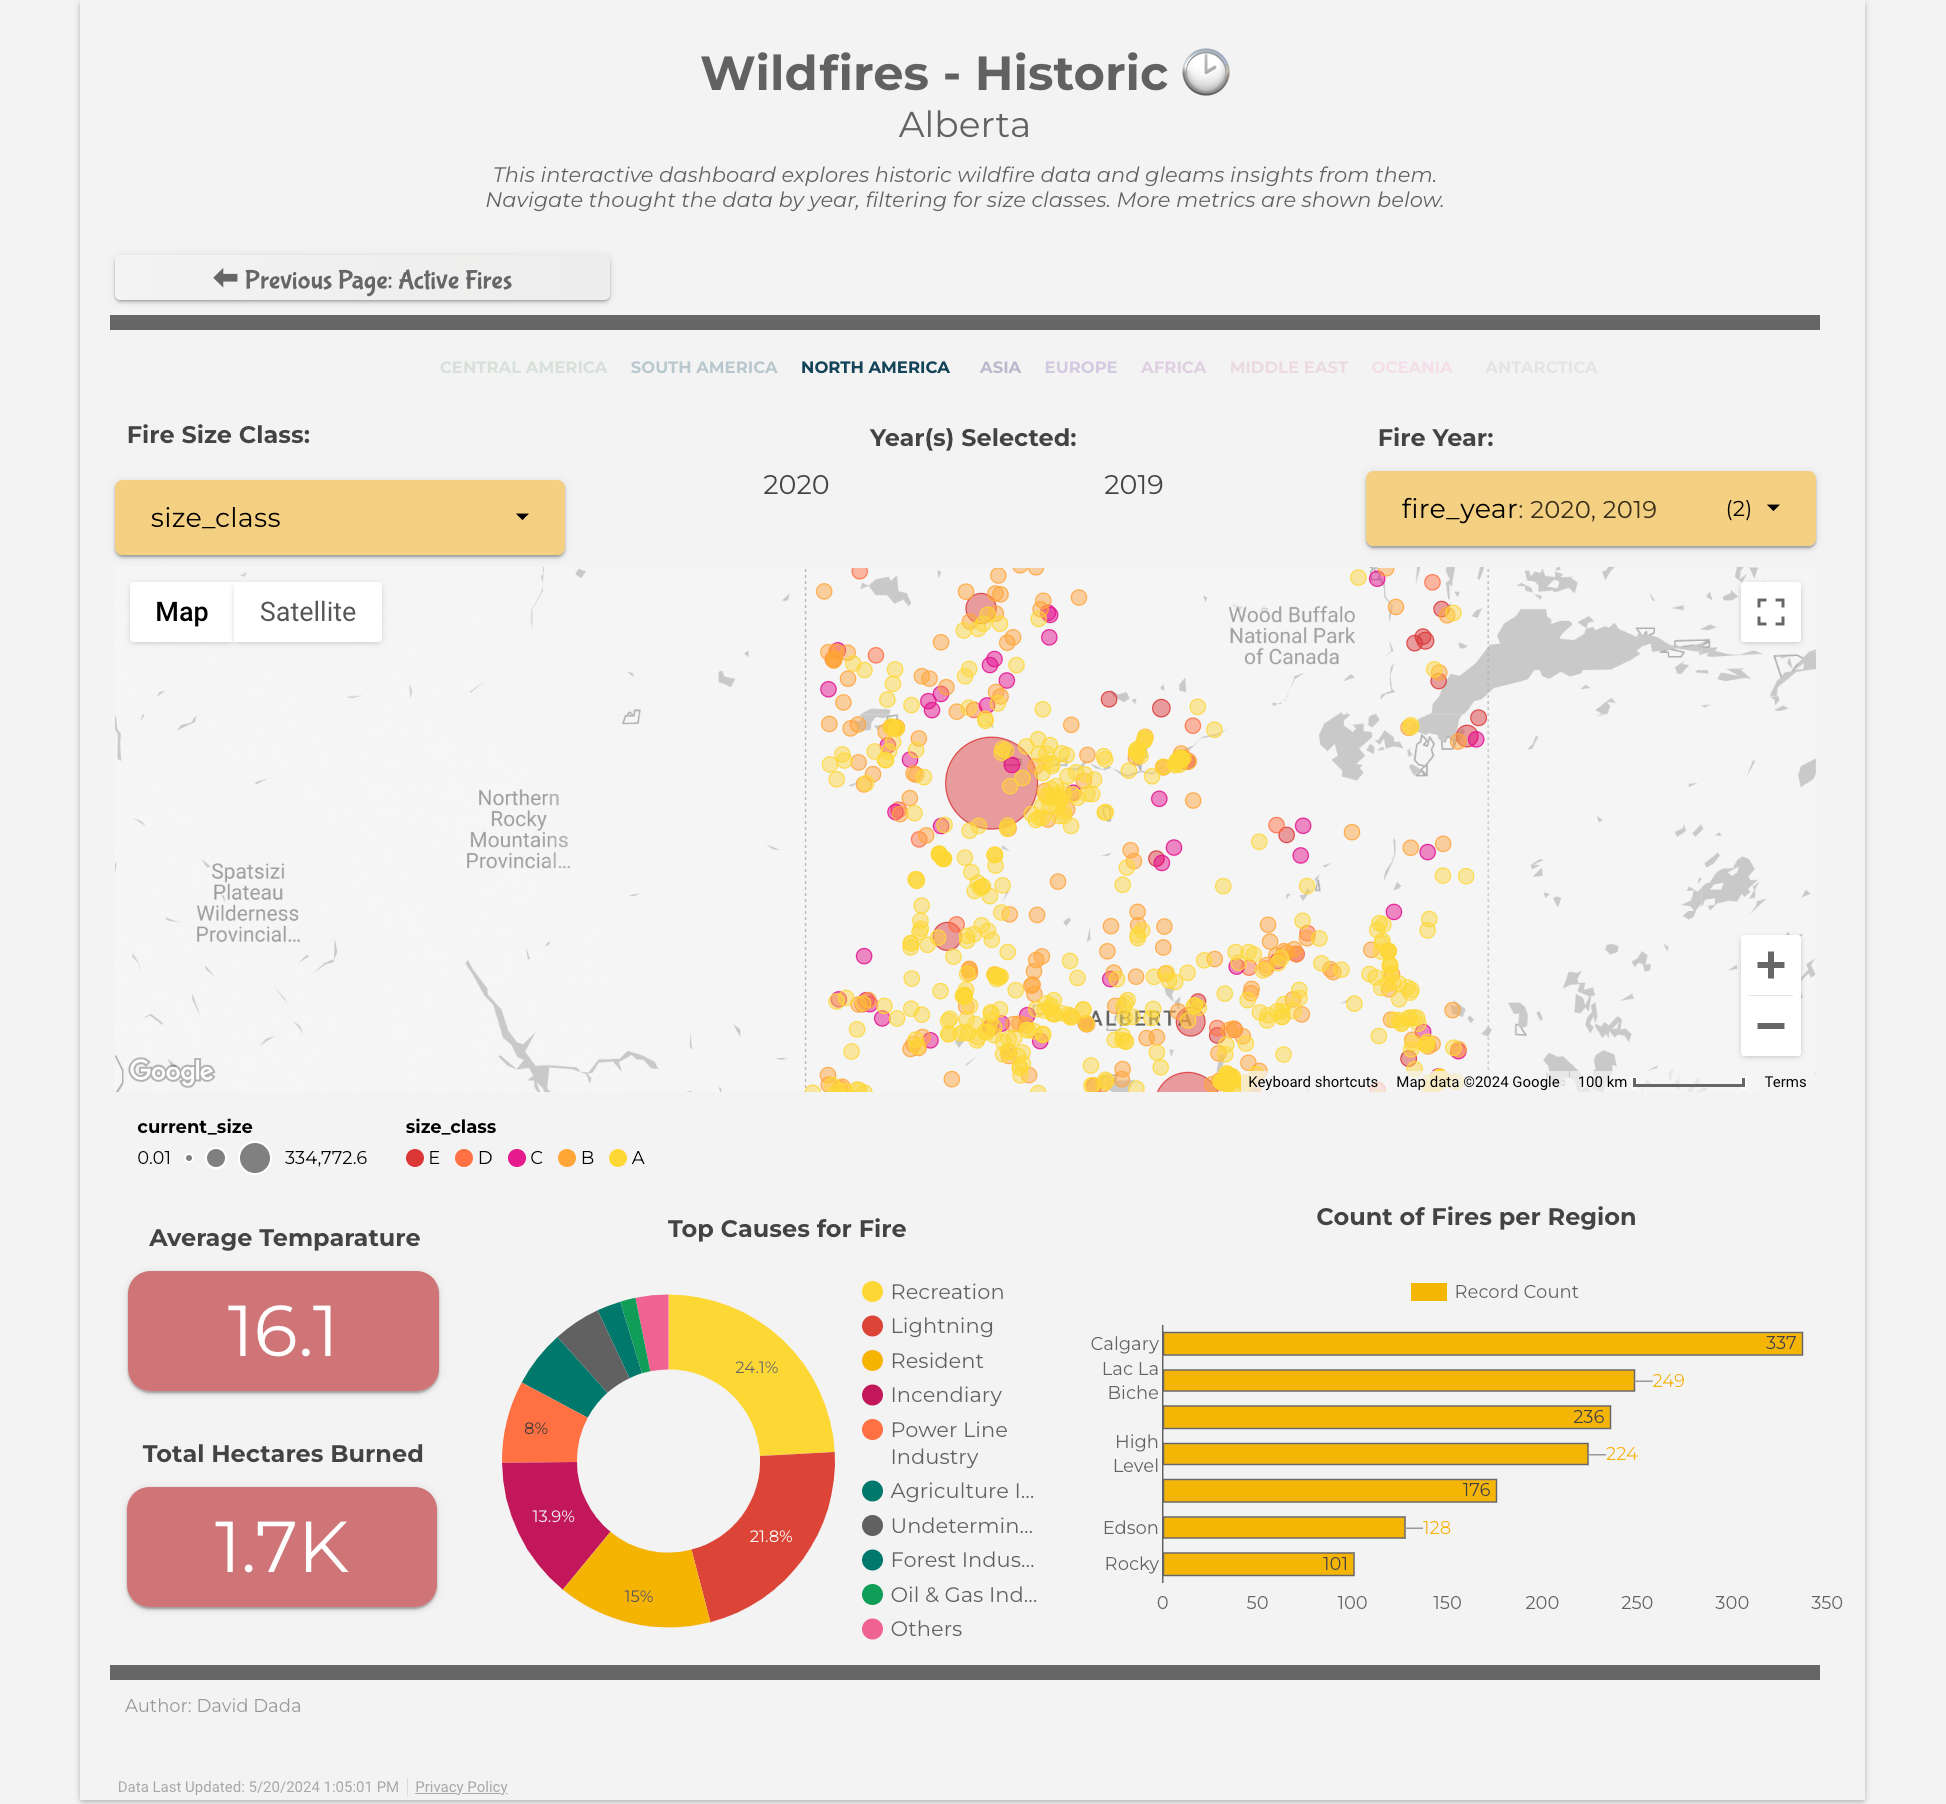
This project leverages wildfire data to story-tell. Its core aim is to deliver valuable insights by analyzing both historical and ongoing wildfire incidents. In the era of climate change, there's a growing urgency to monitor and comprehend these occurrences and their wide range of causes, including human error.
As a resident of a town that underwent a town-wide fire evacuation, observing that data as an anomaly in this dashboard was enlightening. During the project's inception, my town was also under a fire-watch warning, with some residents already evacuating. It was reassuring to note that the fire encroaching upon my family's hometown was now under control according to the latest daily data. Ensuring the accuracy and currency of this project remained imperative throughout its development.
- Extract historical and active wildfire data
- Transform & Load the data into a Data Lake
- Provide insights and reports which support data-driven decisions and provide insight into wildfires.
Alberta Historical Wildfire Data
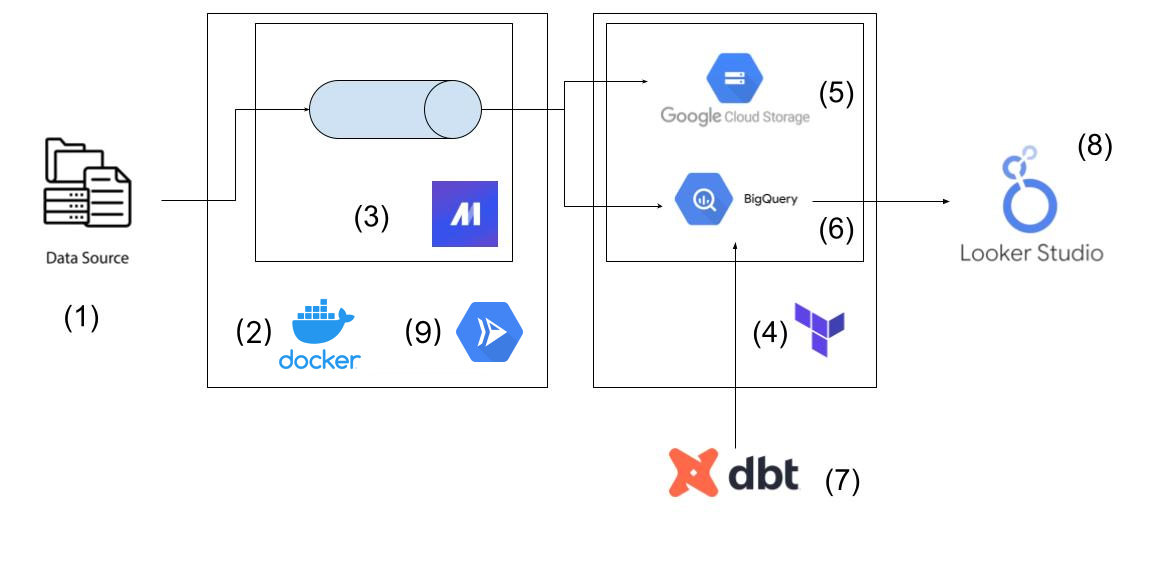
- Open City Data, Canada Active Wildfire data
- Dockerized Mage orchestrator
- Orchestration: Python ETL Pipeline in Mage
- Automated Infrastructure as code: Terraform
- Data Lake: Google Cloud Storage Bucket
- Data Warehouse: BigQuery
- Data transformations & Model building: DBT Cloud
- Reporting & Visualization
- Deploy Mage Pipeline to Google Cloud runner
-
Infrastructure Setup: Terraform to build Cloud Storage and BigQuery resources.
-
Environment: Python, Docker
-
ETL Pipeline:
- Extract data: Open City historical fire data
- Transform data: transform to Pandas Dataframe from various sources (Excel & CSV)
- Load the Data: into Data Lake (GCS) and Data Warehouse (BigQuery)
-
Orchestration: using Mage to orchestrate the ETL pipeline. Running daily for active Wildfires only
-
Containerization & Deployment: Dockerized the ETL pipeline for scalability
-
Data Warehouse: Use DBT perform consistent and stable transformations to build a historical fact table
-
Visualization: I made a Looker Studio Historical Fires Report
-
Automation: using Mage, and DBT to enforce data freshness
-
Deployment: Deployed Pipeline to the cloud with tight security
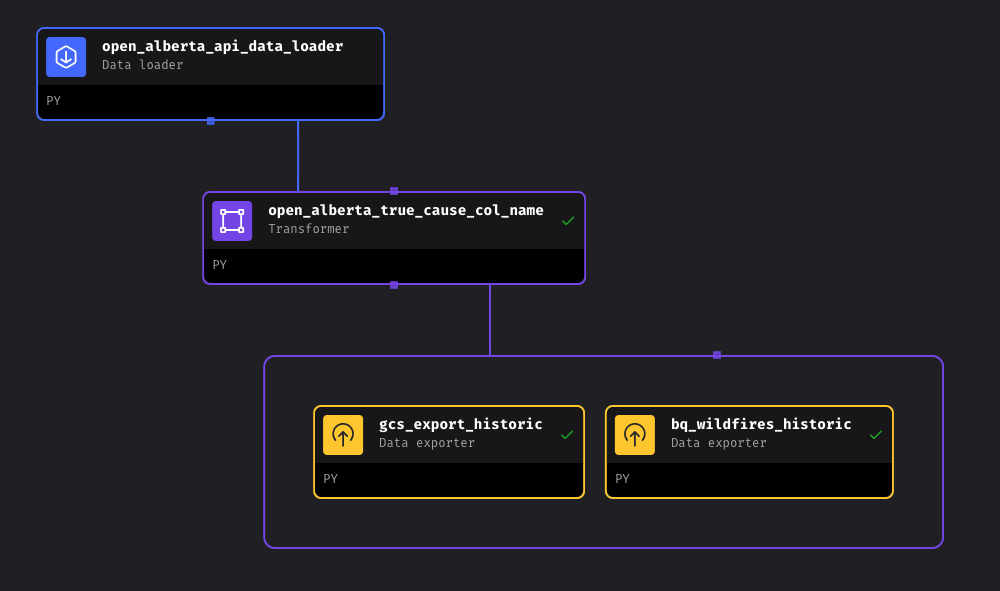
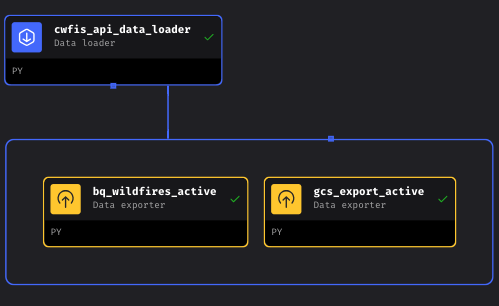
Simple pipeline of an API loader Loading into Data Warehouse and Data Lake
Mage: Orchestration
- Historic: A simple column name transformation was used because the data was messy
- Column name erroneously named
"`"which is an illegal character in BigQuery. - Upon further investigation and referring to the data dictionary, this column should be named
"true_cause"
- Column name erroneously named
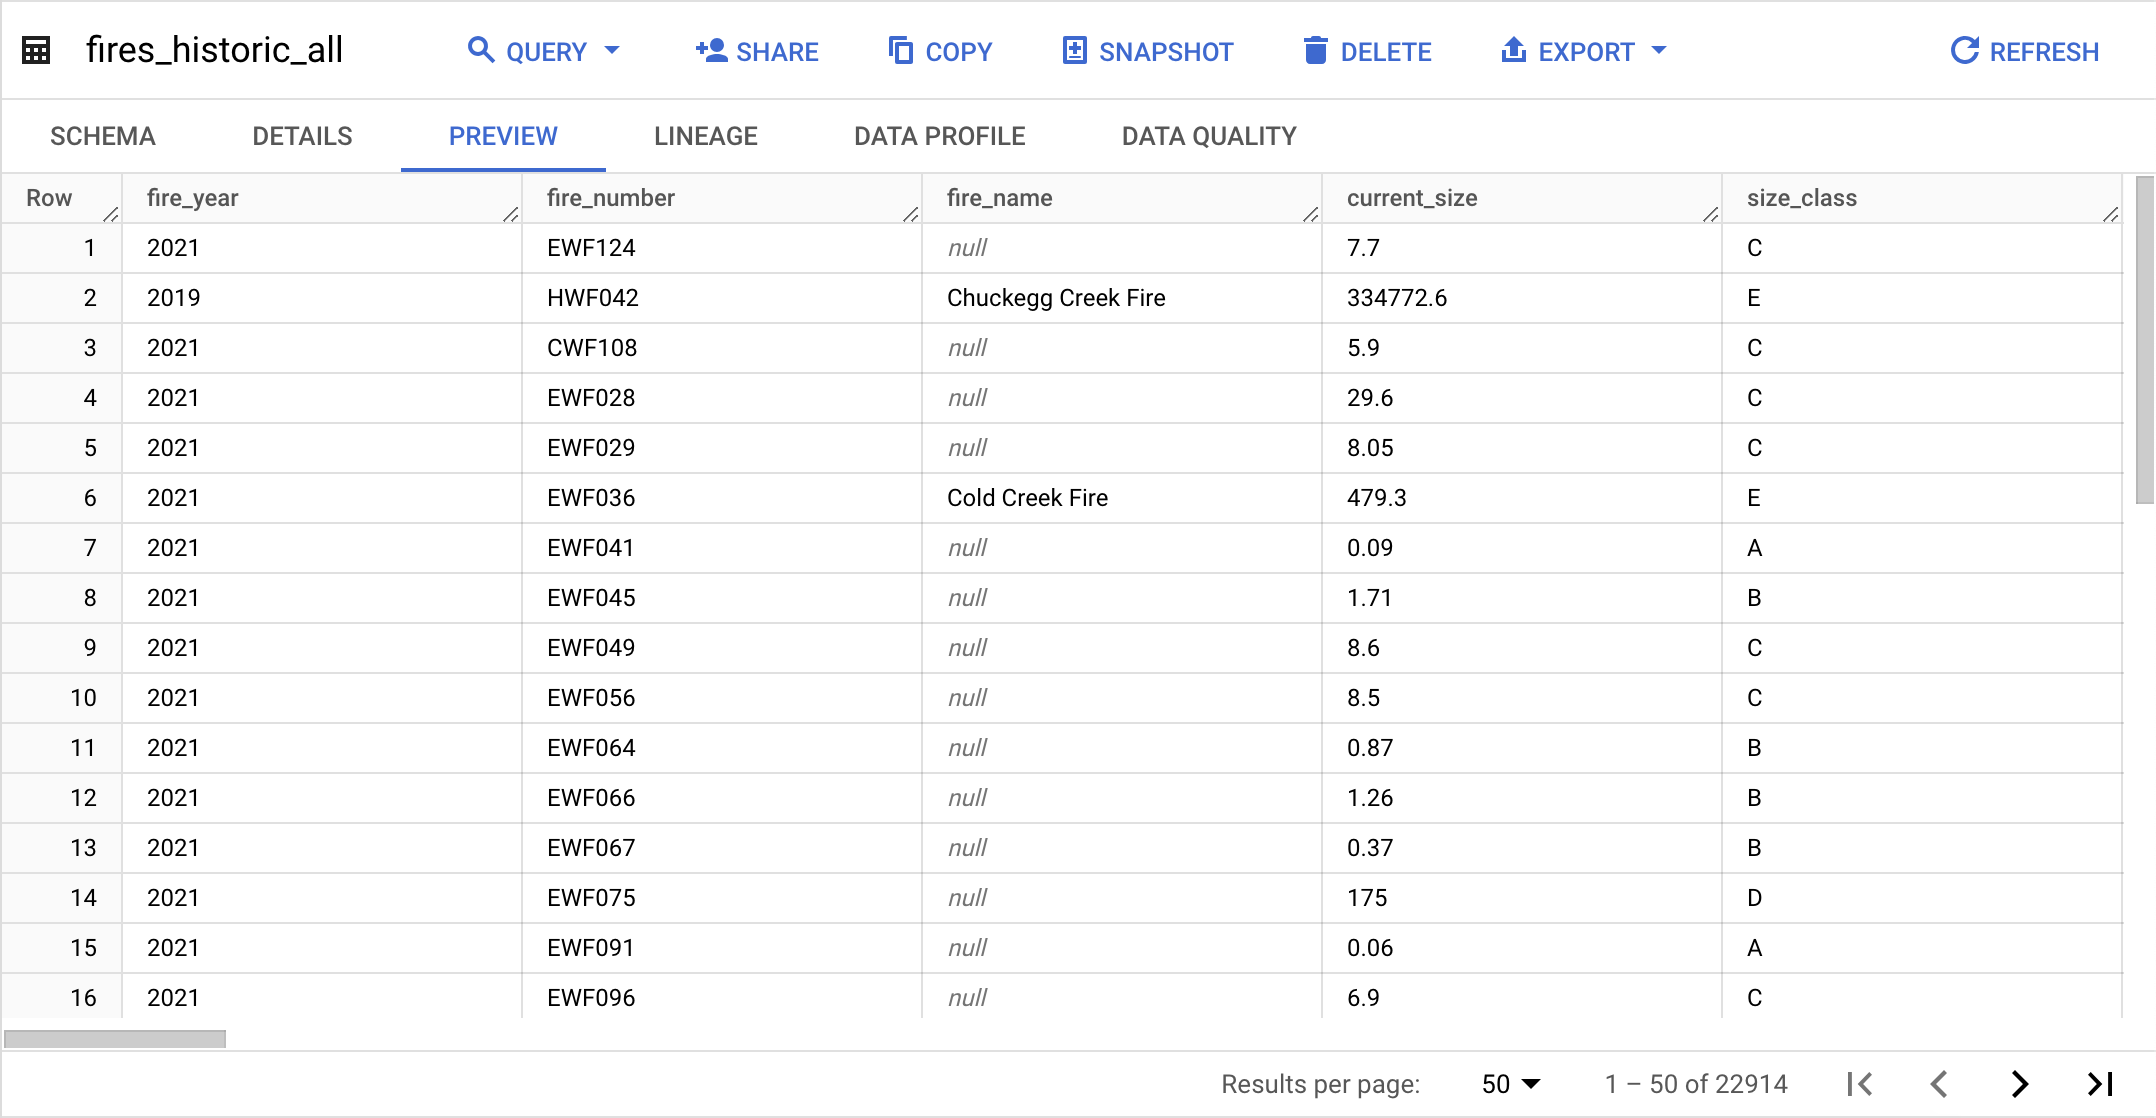
Building a model using seed data and wildfire data to a final fact table for historical fire data.
DBT applies scalable, scheduled and testable transformations to the data, and jobs to ensure the data is fresh.
- Active Wildfire Outliers:
- Active fires listed that had a date beyond the current date. One record existed which threw off the "most recent fire" analytics
Obtained from Alberta's Open City Data. It was presented as a non-text friendly pseudo-table, so the table had to be reconstructed manually:
- OCR to extract text
- LLMs to process and transform text
- formatted as CSV
- Ultimately ended up not using this, but documentation of steps is important https://open.alberta.ca/publications/fire-weather-index-legend
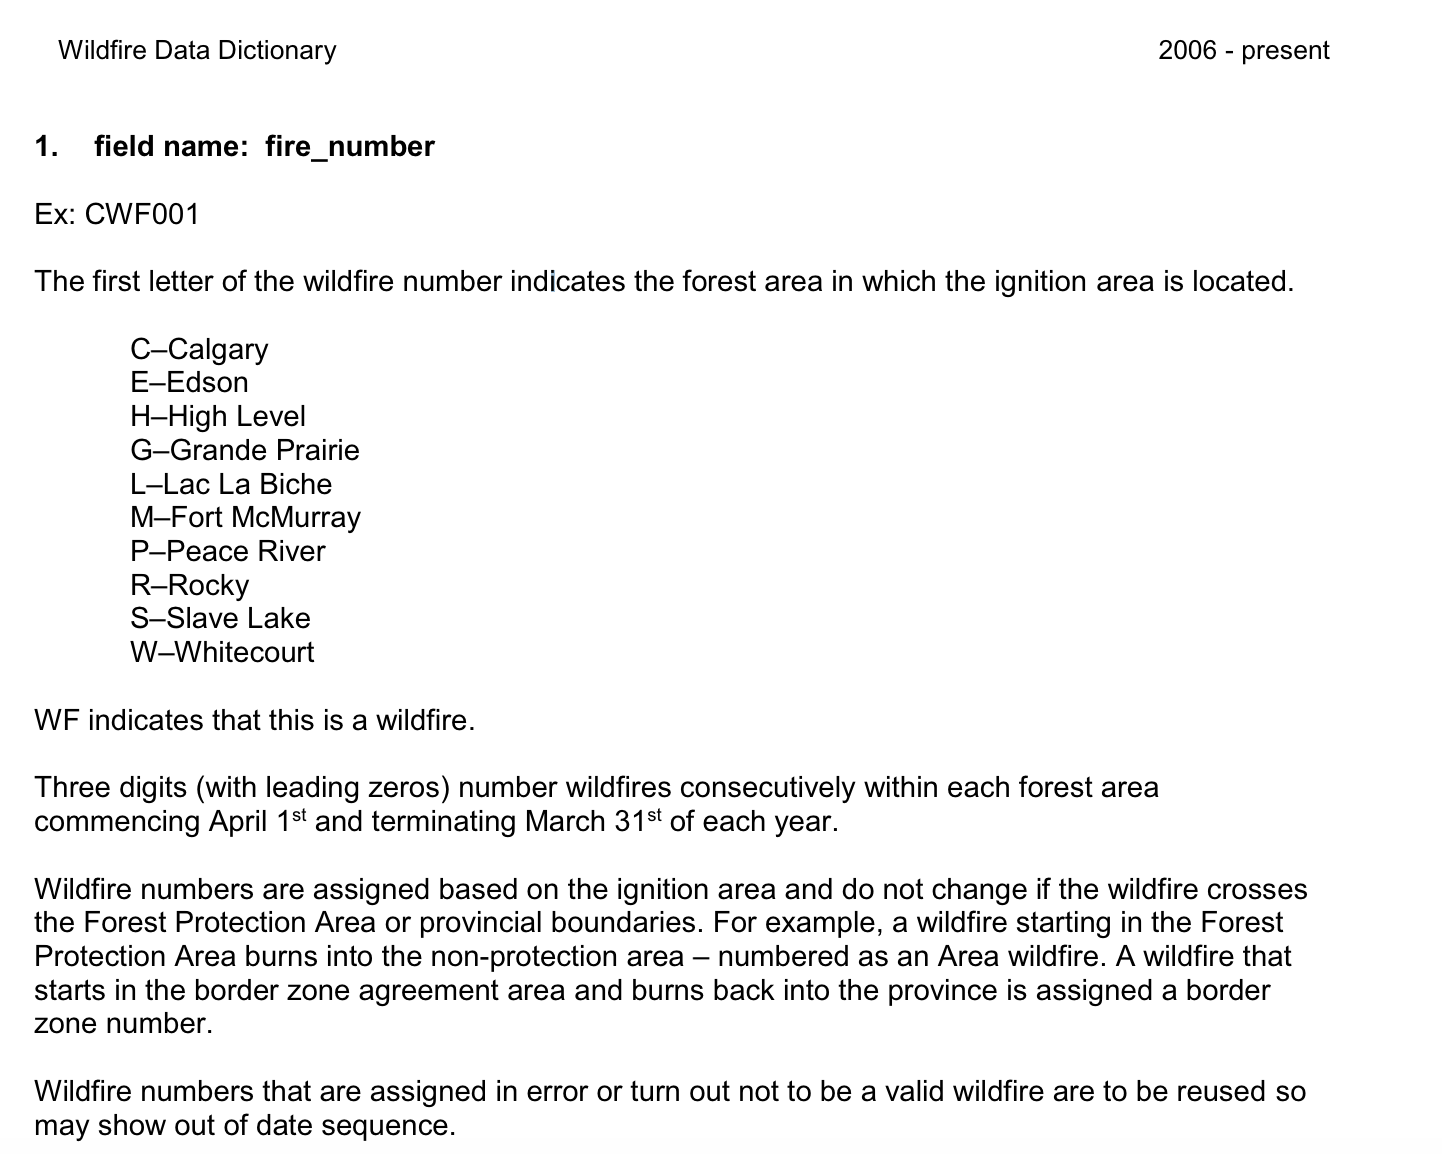
Constructed a separate table of Fire Number data based on text descriptions found in the data dictionary.
This will be inner-joined with the main table to provide detailed wildfire location names.
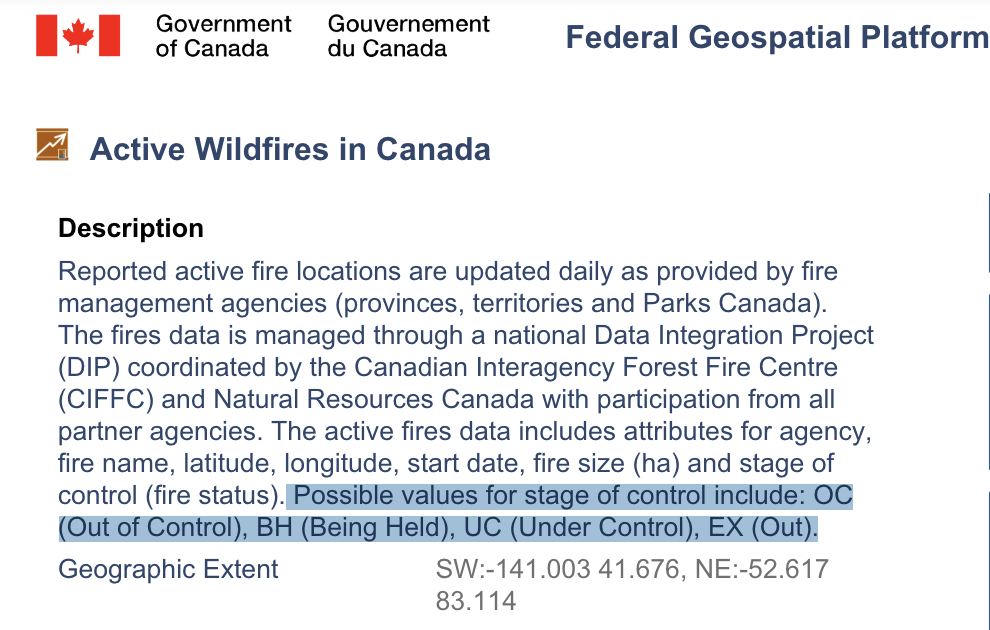
Built a table from the stage of control described below to increase interpretability if the data.
Using LookerStudio to have an interactive dashboard with the following filters.
-
- A lot of fires happen each year. which means too many data points to interpret a single graph
-
- Users would be further break down historic fires
-
- Users might want to filter out smaller fires
-
- The current concern might be to quickly drill down to out of control fires
clone the project
giit clone git@github.com:Dada-Tech/wildfires-pipeline.git
- Create an account
- Generate Credentials for service account
- Roles: BigQuery Admin, Storage Admin, Storage Object Admin, Actions Viewer
- Save the key to the /keys, it will be referenced later
- gcloud for CLI operations
- docker: for container orchestration
- terraform for GCP setup
Variables are stored and used from previous steps here in the variables.tf file
- credentials: Service account json credentials
- project: GCP project name
- bucket_name: GCS bucket name
- BQ_DATASET: BQ dataset name
- region: GCP data region
A simple Dockerfile is used to build a mage container. Ensure your key is saved to ./keys because that will be a local volume mount
docker compose up -d
- Create a dbt account for Cloud use
- Connect to your repo
- Automate via Job creation or CI/CD
- Deploy the pipelines in Mage to Google Cloud Runner using Terraform as shown in this guide.
