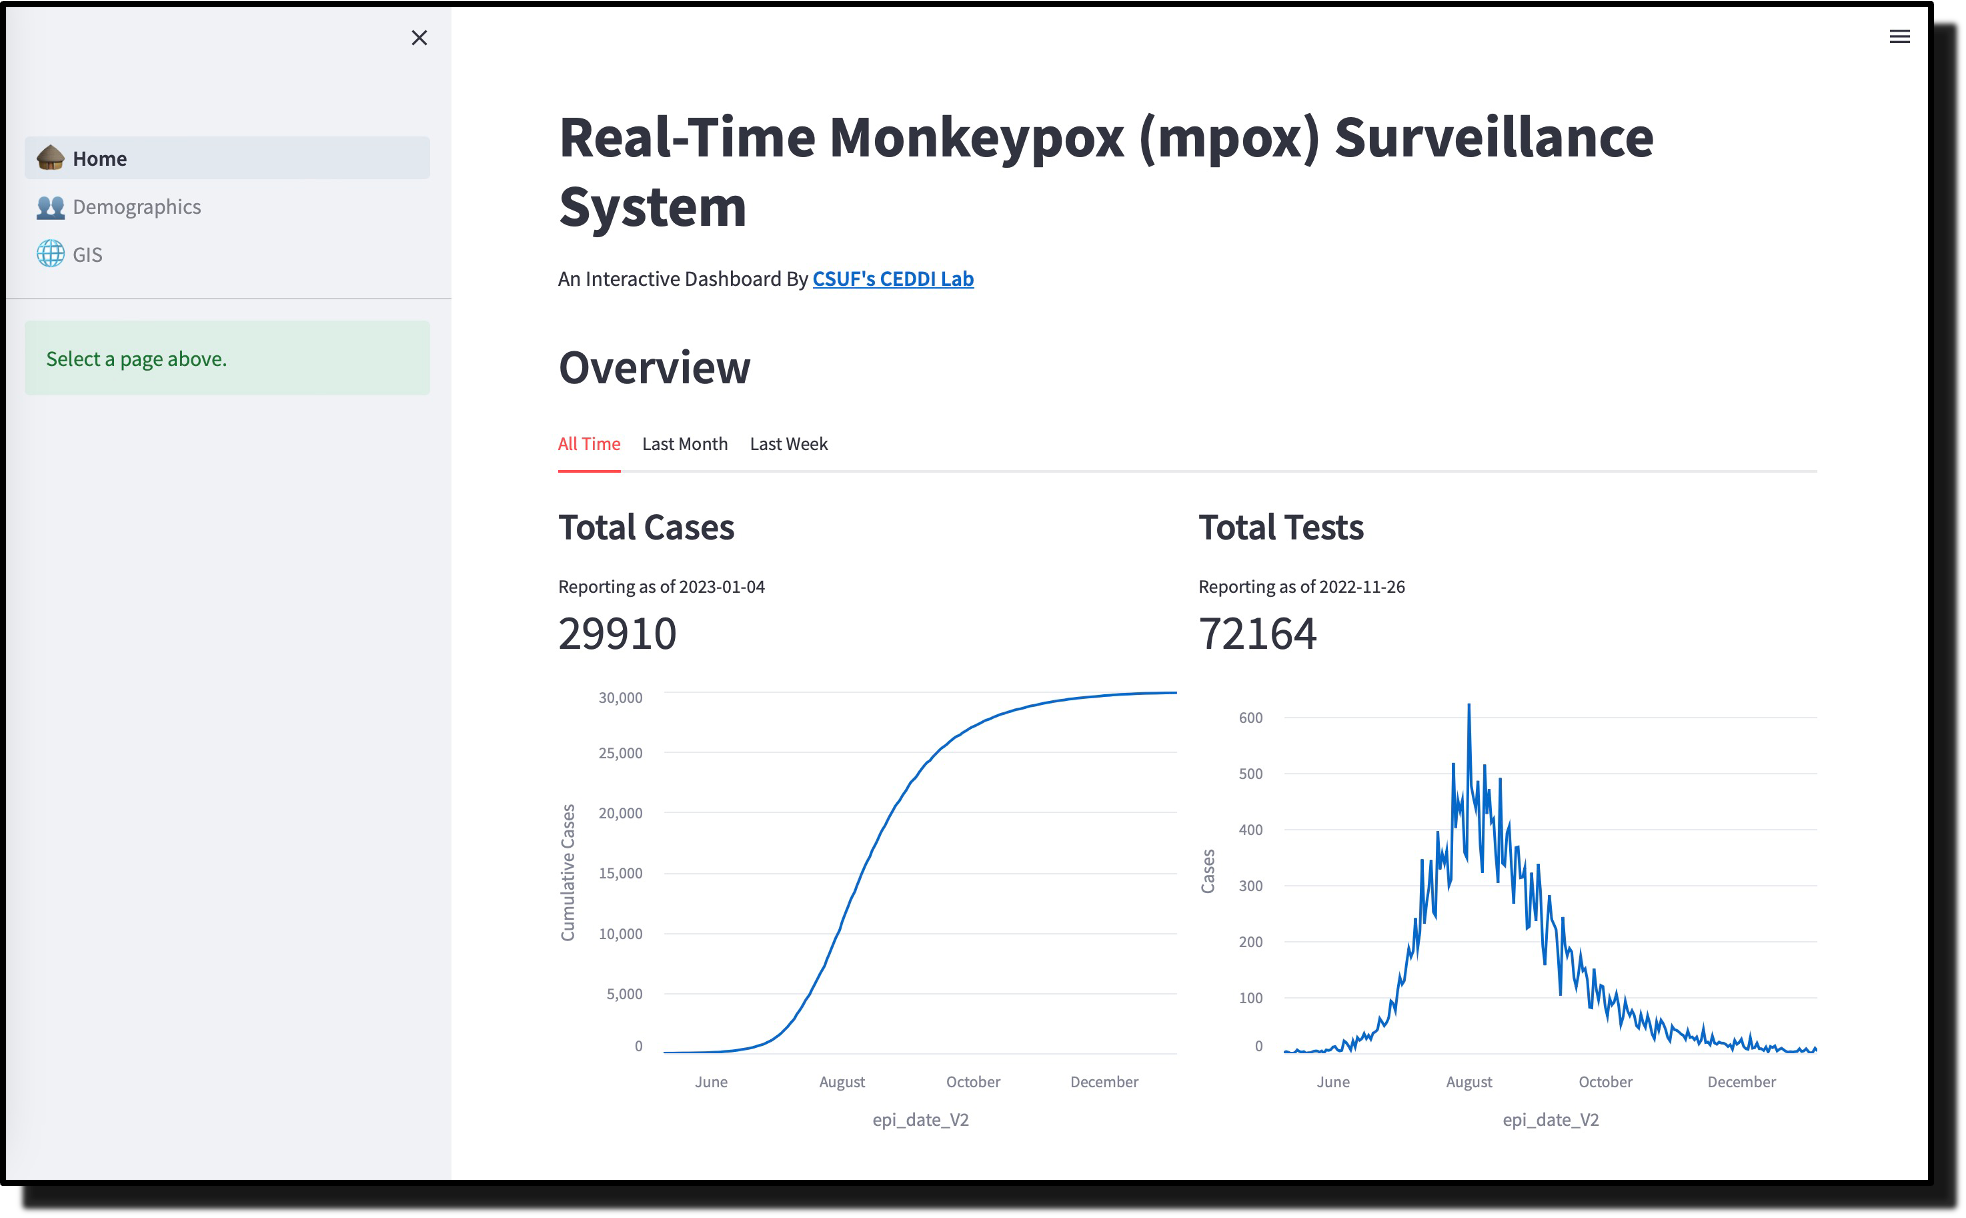
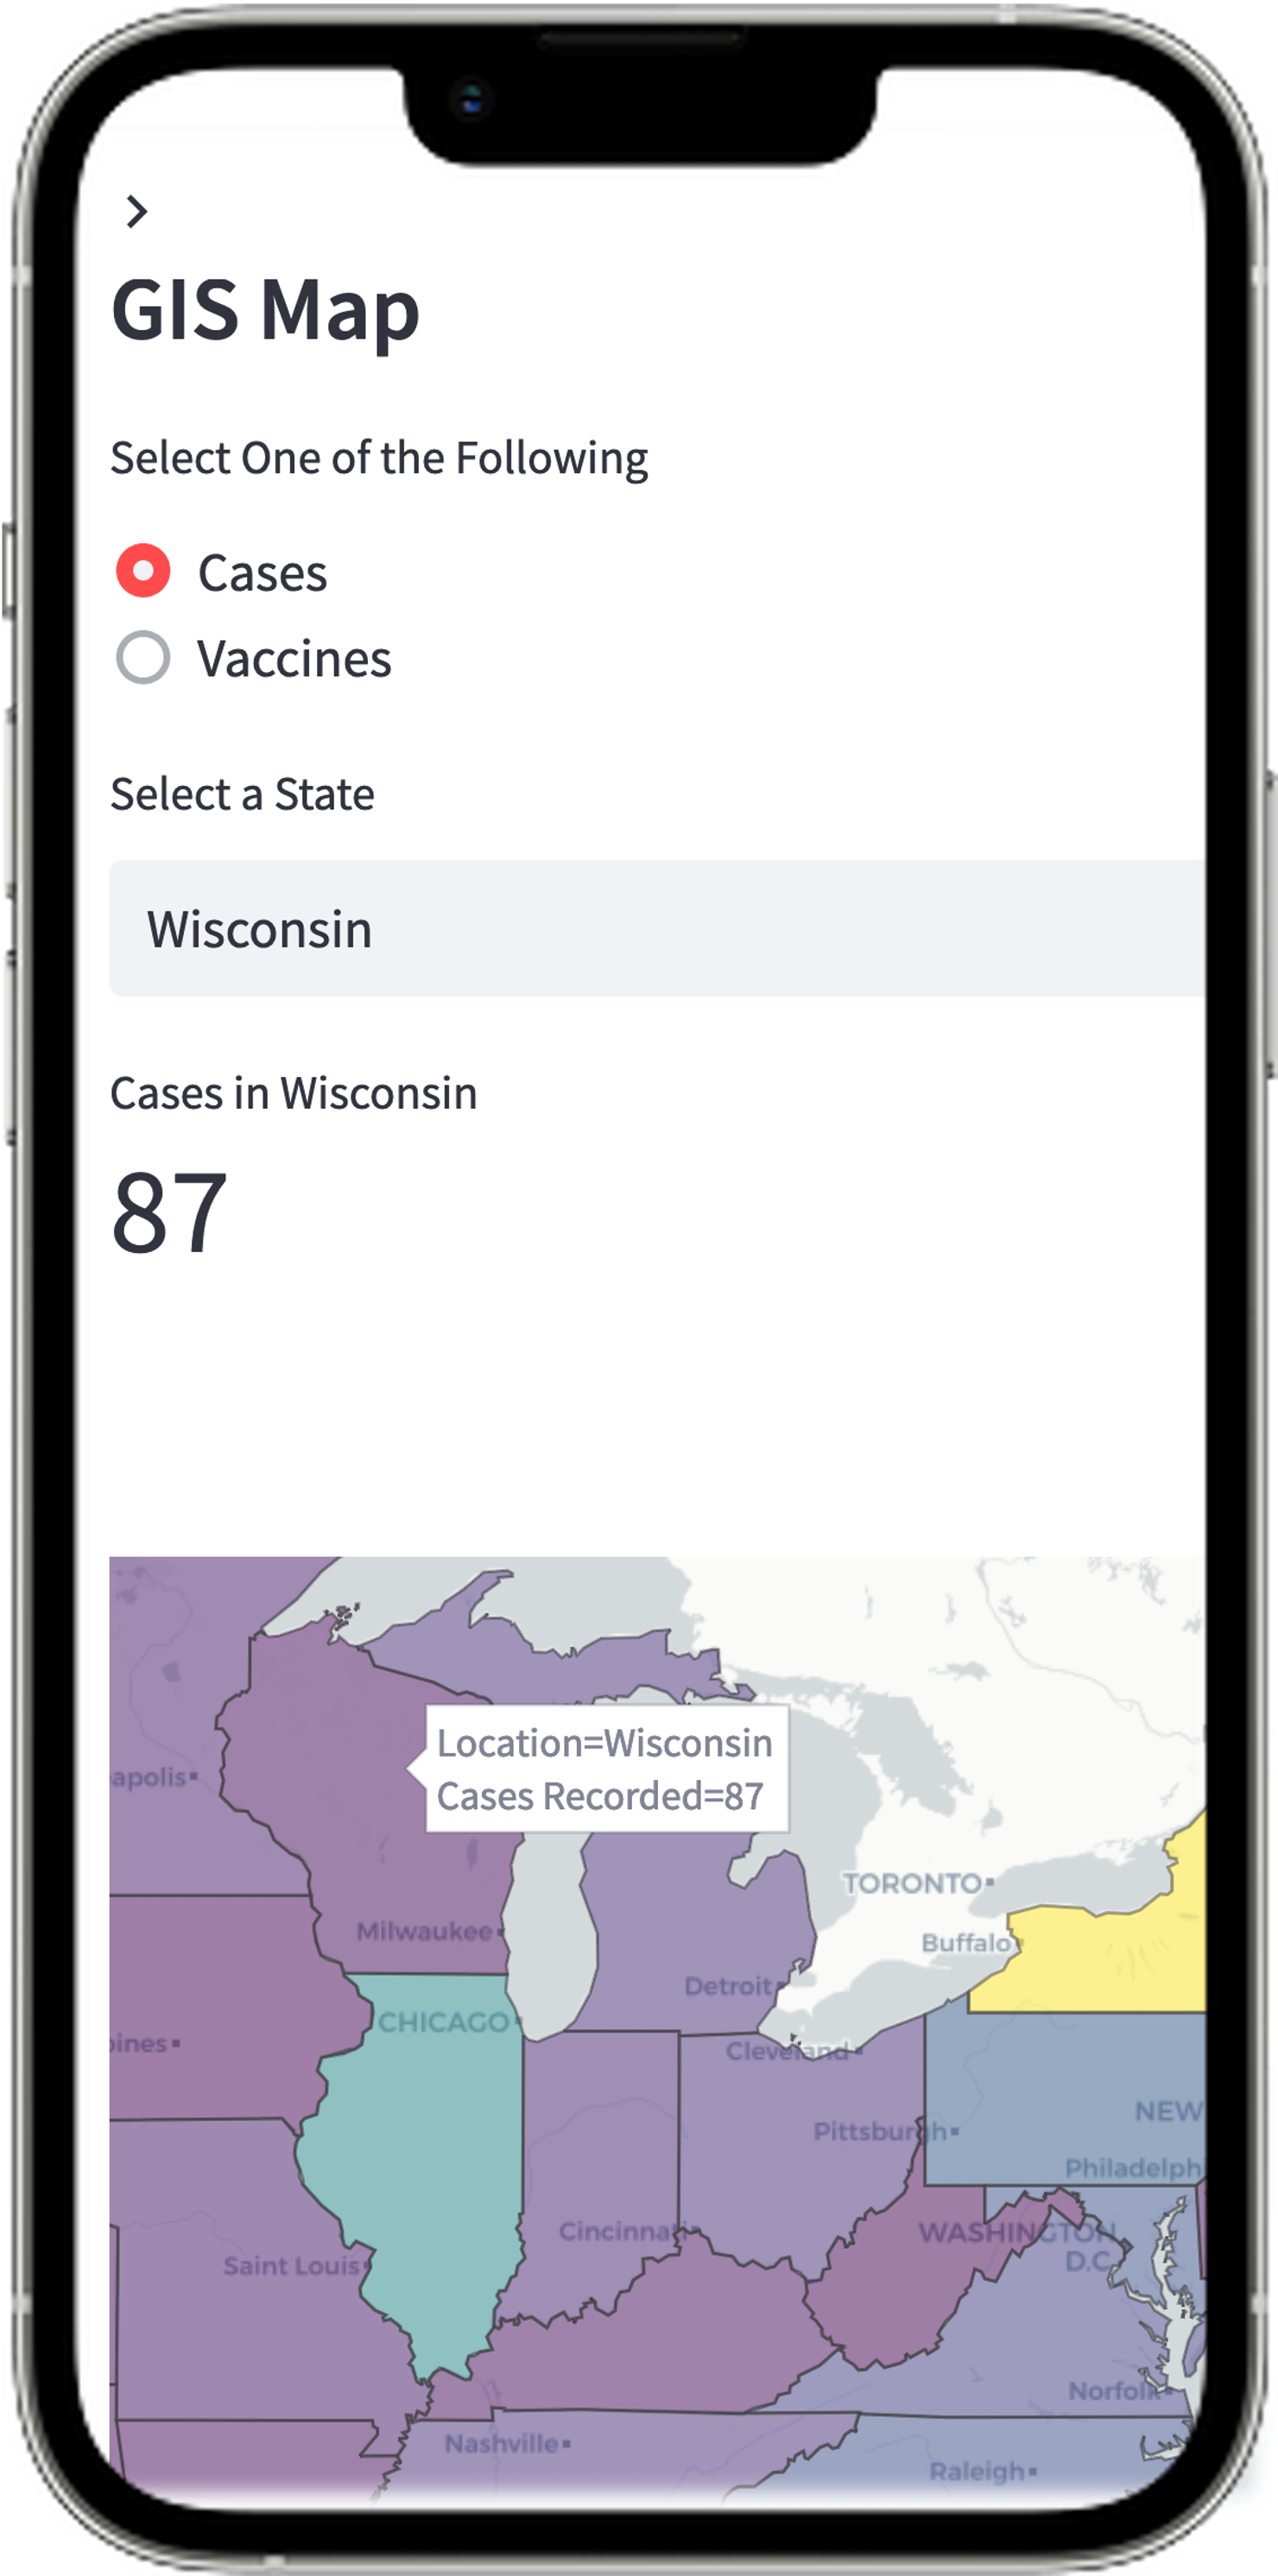
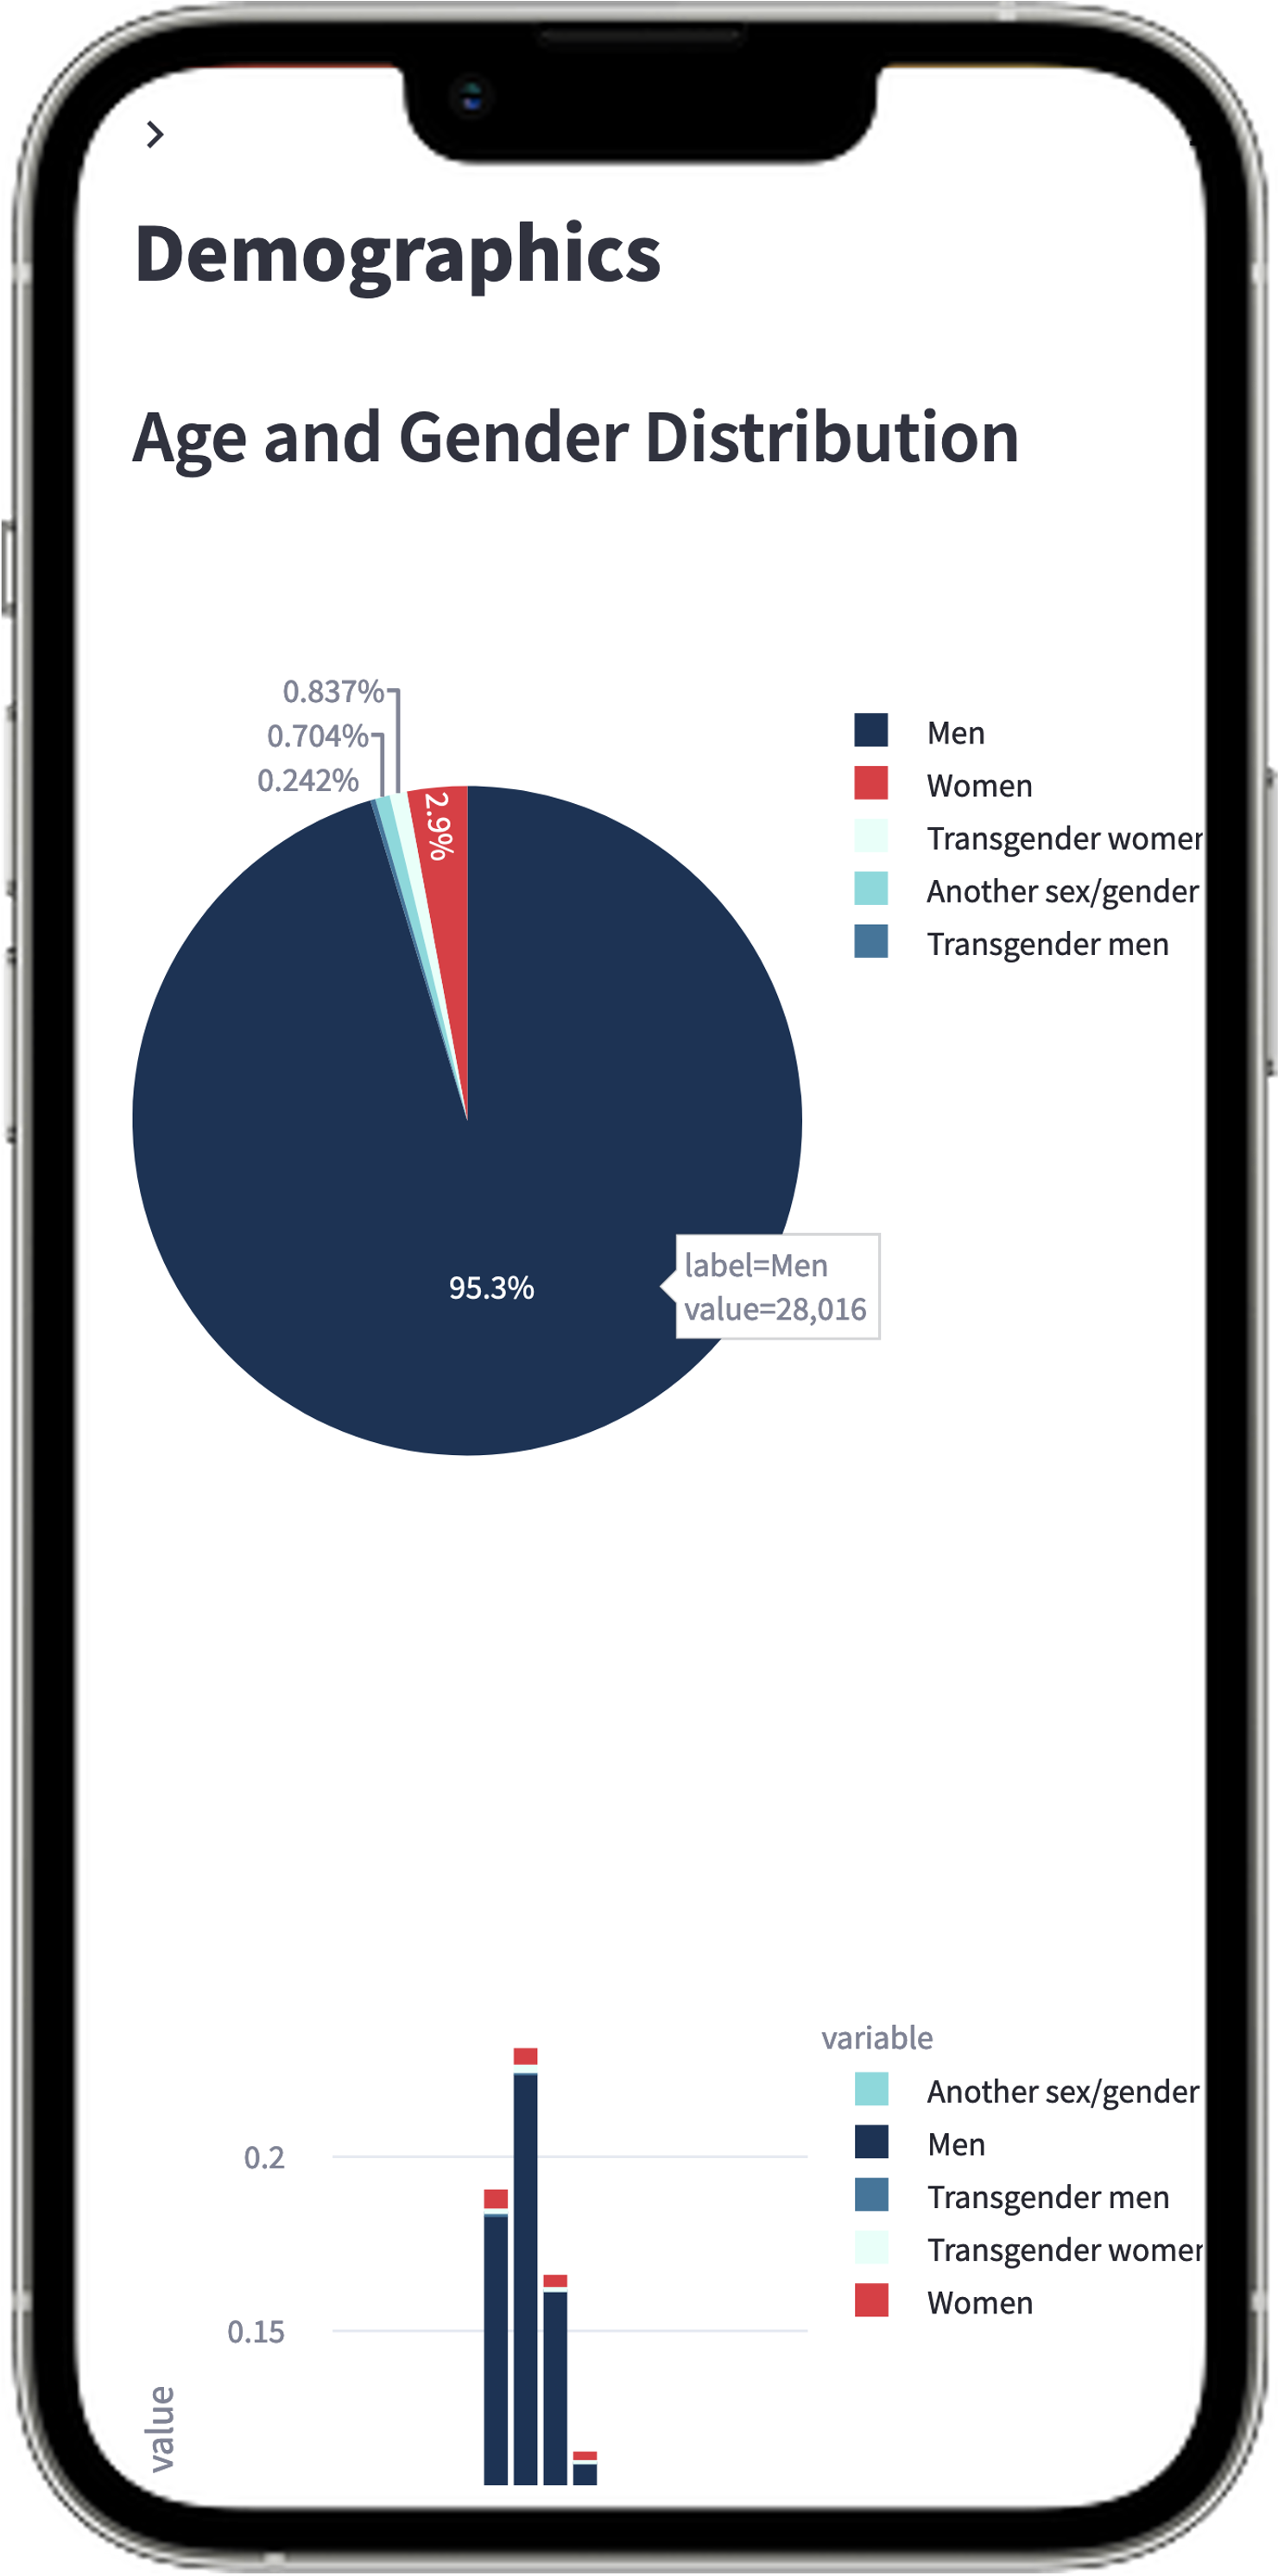
This project offers a mobile-friendly, open-source, web-based dashboard surveillance system that visualizes and identifies epidemiological patterns for any infectious disease in real-time. This dashboard is currently tracking the most recent monkeypox outbreak in the United States and can identify the relationship between public health interventions and the fall of cases in the US. Developed by Daniel Quezada for CSUF's CEDDI Lab.
- Modern telecommunications allow for public health organizations to disseminate epidemiological data
- Lower-to-middle income countries (LMICs) begin to adopt disease surveillance systems similar to high-income countries (HICs)
- Data streams have low enough latency that institutions can publish epidemiological data in near real-time
- Dashboard Surveillance Systems proved to be an effective tool to develop intervention strategies against prevalence of SARS-CoV-2
- Surveillance Systems in LMICs are typically outdated and still rely on data from paper-based records
- Without proper surveillance, outbreaks are more likely to spread to neighboring communities, provinces, or nations
- Human monkeypox (mpox) is a zoonotic viral infetion that is extremely transmissible upon close contact, especially through sexual contact
- Most recent outbreak of 2022 represents first time in almost twenty years that mpox has had an outbreak outside of Africa
- Currently there are no FDA approved therapeutics or vaccines for mpox specifically
It tracks relevant epidemiological data such as:
- Total Number of Confirmed Cases
- Total Number of Vaccines Administered
- Gender Distributions of Confirmed Cases
Visualizations were created with Plotly & may come in the form of:
- Choropleth maps
- Bar charts
- Line charts


