Effective radiative forcing time series
This repository generates the following data and plots from the Climate Indicator Project:
- Greenhouse gas concentrations 1750-2022
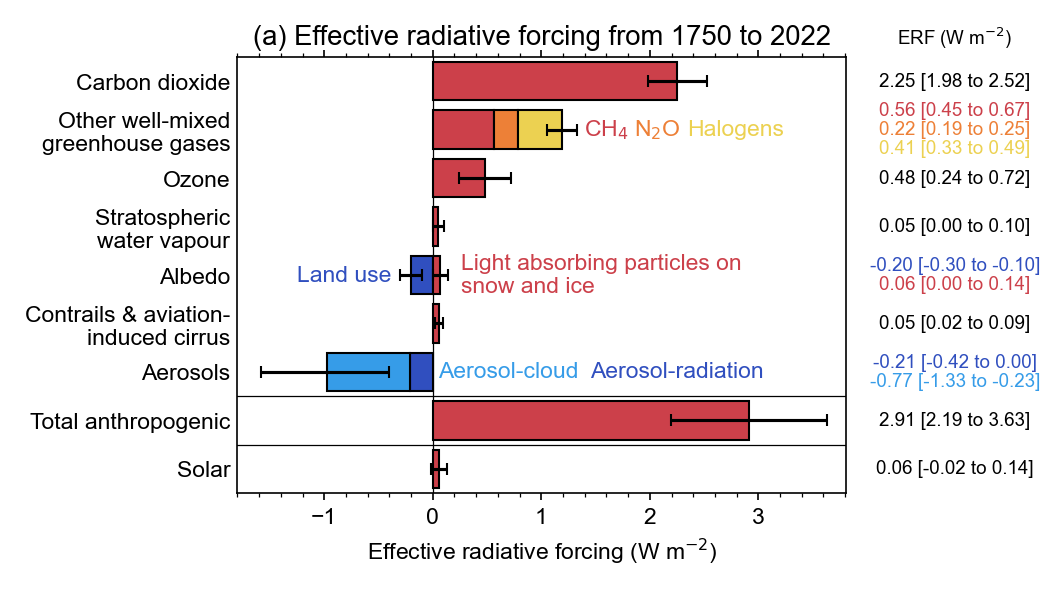
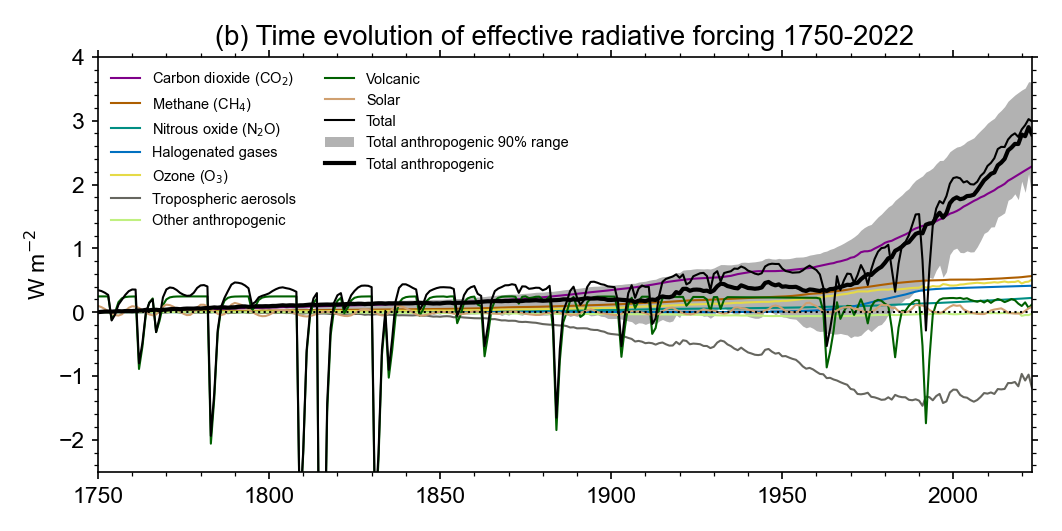
- Effective radiative forcing 1750-2022
As part of the ERF time series, emissions are processed from CEDS and GFED.
The code also provides a probabilistic ensemble of 1000 forcing time series for the detection and attribution of climate change.
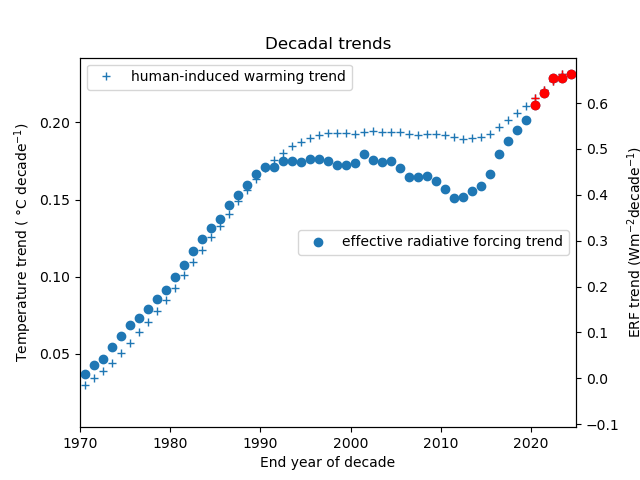
Code also caculates decadal rates of ERF change and human induced warming change

Reproducibility
Create a conda environment. From the top directory of the repository run
conda env create -f environment.yml
The code is a series of notebooks in the notebooks folder. Some generate emissions or concentrations and need to be run first. This order should work.
biomass-emissions.ipynbslcf-emissions.ipynbtrace-gas-global-mean.ipynbvolcanic-forcing.ipynbmake-forcing.ipynbforcing-analysis.ipynbradiative-forcing-barchart.ipynbDecadal.ipynb
All ancillary data is provided in the repository or downloaded by the code except for three volcanic datasets that require registration. See the notes in the volcanic-forcing.ipynb notebook for how to obtain the data and where to download it to.
The Decadal trend plot uses data generated by the athropogenic warming repository

