Biological Image Analysis Project: Case study of leaf epithelium
A guided project to put your knowledge of image analysis into practice. You will be assessed on your ability to build a database, create a python mini-package to resolve three goals and document them.
Dataset and Motivation
The proposed dataset for this project is accessible on Zenedo.
You should download the cellImages.zip file and unzip it in the data folder.
Note that this dataset is very diverse. You will have to choose a subset of the data to work on and document your choice in the data README.md file. In data you can find some examples of this dataset.
Motivation
In plants, epithelial tissues are widely present and they play several important roles; for example, in leaves, the leaf epithelia protect the plant tissues from the environment, and these protective layers also participate in the gasses and water exchanges required for the plant. In these tissues, the cell shape varies a lot and arises from the tissue mechanics, established during the leaf formation (Sapala et al, 2018). By analyzing the shape of cells in leaf epithelia, we can gain insights into the tissue's structure, function, and development.
Image analysis techniques are particularly useful for studying biological images, as they allow us to extract detailed information in a (semi-) automatic and quantitative manner. This can be very long and painful to do by hand; it also allows you to control the potential bias of the analysis.
We could broaden our general understanding of leaf epithelia and answer important questions from this field, thanks to a robust image analysis pipeline, where by using Python, we would analyze the raw image data. This task is particularly challenging as, in the context of epithelial tissue, the cells can have complex and variable shapes. Additionally, epithelial cells often overlap or are partially obscured by other cells or structures (for example vein leaf), which can make it difficult to accurately segment them. The pipeline you will develop might be sensitive to the quality of the images and may not work well for all types of epithelia (It's not surprising, there are so many of them!). You need to find a way to build the most generic pipeline or a pipeline where the meta parameters can be easily adjusted according to the epithelia image diversity. It is also an opportunity to discuss the limits of your pipeline.
Learning Goals
Prior skill and knowledge
This project is designed for students who have some knowledge of the following (if not all, it should ring a bell):
- Python: loops, function, numpy, pandas, matplotlib
- Read and analyse scientific papers
- from microscope to the image analysis pipeline main steps (pre-processing, segmentation, feature extraction, classification, post-processing)
- Curious to learn how to apply these skills to a given biological problem
Biology Goals
Take time to understand the following notions and find your own definitions:
- Turgor pressure
- Abaxial / adaxial
- Epidermis, epithelium
- Microtubule
- toluidine blue staining
- Cell wall vs membrane
Code Goals
- Coding in a team: This will involve collaborating with team members to plan, design, and implement the code, as well as troubleshooting and debugging any issues that arise.
- Manage a database: This will involve creating tables and columns to organize their data, as well as importing and exporting data as needed.
- Write a documentation: This will involve including docstrings and comments to explain their code and the purpose of each function as well as typing variable.
- Reproduce a figure from a paper: This will require you to understand the methods and results of the paper and implement them in your own code.
- Build an image analysis pipeline: This will involve selecting appropriate image processing techniques and implementing them in Python to extract relevant features and analyze the data.
Project Goals
There are three main goals for this project. Take a moment with a pen and paper to write down your pipeline ideas and connect them between each other. This is a good way to find a first structure draft for your code.
All the use cases should be implemented in the same python package in the src folder.
Dataset: Leaf Epithelium
This dataset is composed of pair of "leaf-level" images and "cell-level" images. You have to use the cell-level images to answer the following questions. You can use the leaf-level images to help you understand the dataset if you are curious about the plant.
Maintaining a database is a difficult job. You have to create your own database and create a database README (see template). It is very important to document and clean your database before you start to code. If you remove some images from your dataset, you have to document it in your database README.
Goal 1: How many cells?
Counting the number of cells in a leaf epithelium is important for understanding the overall structure and organization of the tissue. It can also provide insights into how the tissue grows and develops over time.
This specific goal will have to be very versatile. During the week (on Thursday), you will receive a 20 new images from another dataset. You will have a limited time to use your code to count the number of cells in the new images and send their positions in the image. Please note that the new images will look like the previous ones with some differences (for example bigger membranes? who knows what leaf can create...). This "harsh deadline" is used to make sure every student is able to use and understand the code the group coded. This could happen in real life if your colleagues are in holidays and reviewer 3 asks you to create a new figure to check your result.
Note
Owners and administrators can add outside collaborators to a repository.
- You have one hour
- You have >30 new images of epithelium
- Adapt your pipeline parameters to count all the cells for each image
- Create a zip folder with
- A csv table with 3 columns
how_many_cells_database.csv: image name, number of cell, csv file with their center - one csv file per image named
cells_centroid-image_name.csvthat contains a list of centroid of each cell per image. You should be able to open this file with a drag and drop in napari to create a point layer.
You can find an example in the folder results/how_many_cells.
Warning
For this use case, you will be graded on your ability to parameter quickly your code. You must have prepared your code during the week so that it is usable on the day of the exam (Thursday). Each person must have the code working on their computer because this deliverable is individual.
On Thursday, you only have to send the zip folder described above. The code, the documentation and the limitations should be only included in the zip file on Friday along with the others use cases.
Goal 2: Junction Analysis
Examining the connections between cells in a leaf epithelium is important for understanding how the tissue functions as a whole. These connections can help transmit signals, support mechanical forces, and provide structural support.
Here we will look at specific cell organisation: can we find junction shared by 4 cells (T1 process) or more (rosette) in the epithelium. (figure from The same but different: cell intercalation as a driver of tissue deformation and fluidity | Philosophical Transactions of the Royal Society B: Biological Sciences)
This could be the first step to get the dynamic of the epithelium, if the dataset includes time-lapse images, you could try to track the junctions over time. But this is not the goal of this project (yet!).
 from Tetley Robert J. and Mao Yanlan 2018 The same but different: cell intercalation as a driver of tissue deformation and fluidity Phil. Trans. R. Soc. B3732017032820170328 http://doi.org/10.1098/rstb.2017.0328
Note
- You want to check if there are junction where more than 3 cells are touching each other.
- Create a folder with
- A csv table with 4 columns : image name, number non triangular junctions, total nb of junctions, csv file with their center.
- one csv file per image named
non_triangular_junctions-image_name.csvthat contains a list of centroid of each occurence of non triangular junctions per image. You should be able to open this file with a drag and drop in napari to create a point layer. - One figure of a bar plot showing in x the species and in y the measured (non_triagular / total) value for each image. (see example graph below)
You can find an example in the folder results/how_are_cells_connected. Please note that "touching at the same place" depends on the resolution of your image. Discuss you design choice to determine when 4 or more cells are touching in the README.md.
Goal 3: Quantification of cell shape
Note
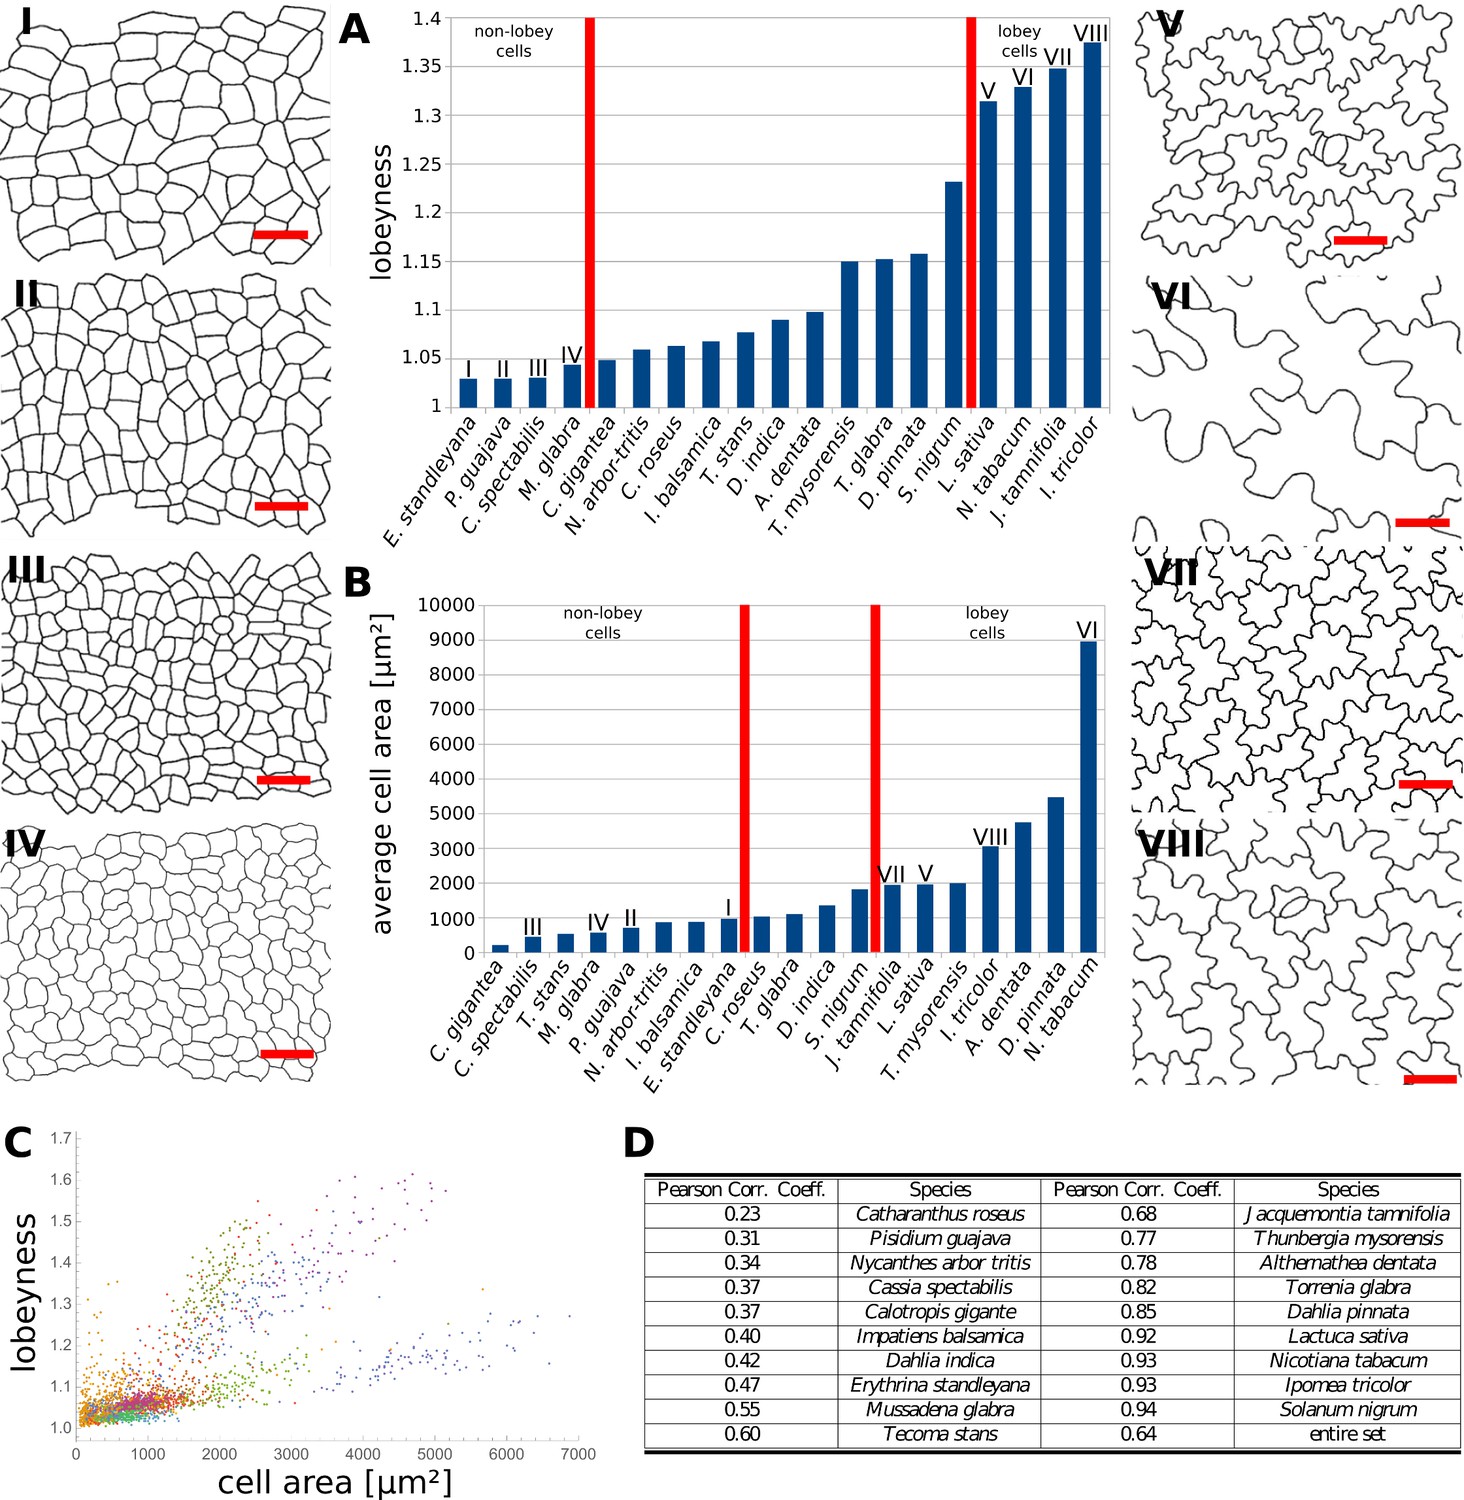
- According to Sapala et al (2018), the cell morphogenesis depends on the mecanical stress. We want to reproduce the figure 6.A (but with violin plot rather than bar plot) and 6.C with our database.
- Organise the result folder as you prefer
- Consider creating a "parametric map" of the morphogenesis quantification criteria you choose as intermediate results in your notebook.
- Discuss the results and the limits in the README.md
Deliverable
You will be graded according to 3 sections that you have to send Friday. These materials inside each sections should reflect your work in the three [[Analyze leaf epithelium#Use cases|use cases]].
Note that one part of the [[Analyze leaf epithelium#How many cells?|"How many cells?"]] use case should be deliver erlier in [[Analyze leaf epithelium#Thursday|Thursday]].
Your Code / 12
Your code must be written in python. It will be evaluated according to these criteria for each of the use cases:
- Documentation : Your code should include clear and concise docstrings and comments to explain its purpose and how it works. Consider using typing and explicit variable name.
- user interface : You should have in your code 3 user interface. The code should allow anyone to reproduce your results you present in the README.md
- Scripts: One or more Python scripts where your functions are stored. These should be clearly organized and easy to follow.
- Notebooks: You should have at least one Jupyter notebook to launch napari, create intermediate results, and create graph figures. It is recommended to have one notebook for each use case in the project. The notebooks should be clearly organized and easy to follow standalone. Do not hesitate to break the notebook in small parts and show intermediate results.
- Napari: You should use napari to show images and tune parameters using a widget. The napari interface should be user-friendly and intuitive.
Your Database / 3
While doing the project, you will produce new results. Save you in a clean database with a csv table to resume the different results. A concise explanation of each result should be included in the README.md.
Your ReadMe / 14
The README.md is a presentation of your project for future reference. It should include written in markdown:
- An introduction : take space to write about the definition and link of all the biological knowledge needed to understand the motivation of the project. /1
- Python dependencies: List any libraries or modules that are required to run your code, and explain how to install them briefly. /1
- A "how to use" tutorial for each use case of your project : 3 * /4
- User case diagram of the different steps: Include a diagram or flowchart that outlines the steps involved in each use case. You can refer to a detailed step-by-step notebook for more information.
- Main limitations/known issues and future developments: Discuss any limitations or known issues with your code or approach, and suggest potential areas for future development.
- Database structure : quickly explain how you database is organised, what are the column names…
Resources
- A. Sapala et al., “Why plants make puzzle cells, and how their shape emerges,” eLife, vol. 7, p. e32794, Feb. 2018, doi: 10.7554/eLife. (Why plants make puzzle cells, and how their shape emerges | eLife)
- Campbell Biology, Chapter 35. In particular figure 35.29, 12.10, 39.8.
- General tips for writing good code: Good Research Practices
- How to create a conda environment: Conda
- General image analysis course: bioimagebook
- Jupyter notebook image analysis tutorial: BioImageAnalysisNotebooks
Advised Planning
The following planning is meant to provide an example of how students can organize their time for the project. The specific versions of the code (e.g., 0.1, 0.2, etc.) and presentations are not mandatory, but are included as suggestions for how to structure the project. Students should discuss and adapt the planning as needed to fit their progress and needs.
The different presentations: (How to share, Architecure and feedback) are not mandatory. They are meant to help you structure your project when we think you may need it. It also allows us to keep track of your progress. Of course, we remain available via the moodle and when we are present in the room.
Monday
- Morning:
- Introduction : Presentation of the project and deliverables. Formation of teams.
- Afternoon
- Alpha :
- Browse the database and understand its organization.
- Quickly review Sapala et al (2018) and other relevant sources to understand the biology of leaf epithelia. Explain the [[Analyze leaf epithelium#Knowledge|definitions]] in your own words and include them in the introduction of the README.md.
- Understand the three objectives of the quantification and the expected results.
- Alpha :
Tuesday
- Morning
- Beta:
- Outline the steps needed to achieve the quantification objectives on paper.
- Learn how to open images in napari. Note that this time, the images have a third dimension (x, y and channels).
- Develop a simple workflow for segmenting cells, focusing on a small representative subset of the database.
- Break down the use cases into independent tasks for coding.
- How to share: Presentation on best practices for code sharing and working in a team of proficient coders that you are.
- Beta:
- Afternoon
Wednesday
- Morning
- 0.1:
- Divide tasks among team members and plan the organization of the code to avoid redundant work.
- Focus on a single image to develop a complete pipeline and get a first result for each use cases.
- Architecture: Presentation on how to structure projects in a repository for maintainability.
- 0.1:
- Afternoon
- 0.2:
- Try your first pipeline on multiple images. To optimize the parameters, create a napari interface to quickly adjust the segmentation.
- Share progress with team members and other teams?
- 0.2:
Thursday
- Morning
- 1.0:
- Stable version of the code that can generate graphs for the use cases.
- Everyone should have the basic code to segment cells on their computer.
- 1.0:
- Afternoon
- Exam: Tell us quickly in a new dataset how many cells and their position. ==You must be individually ready at 13:30==. You will have one hour to create a zip folder as described in [[Analyze leaf epithelium#How many cells?|the use case "How many cells"]]. Only the result folder of this cell counter use case should be delivered.
Friday
- Morning
- 1.1:
- Annotate and structure the code. Create a tutorial for future users of the code. In a form of a detailed README.md / in a detailed notebook.
- Code report deadline: ==Send us before 11h45 a zip folder with your work.== Congratulations and thank you for your hard work. The instructors will review the work and provide feedback.
- Feedback: Students are welcome to join a closing discussion to share their impressions of the project
- 1.1:
Contributing
You can contribute to this project by forking the repository and submitting a pull request. We will review your changes and merge them into the main repository if they are relevant.
Contributors: Clément Caporal, Camille Duquesne and Louise Dagher This projected has been created for the Learning Planet Institute bachelor