
notBoxPlot is a MATLAB data visualisation function.
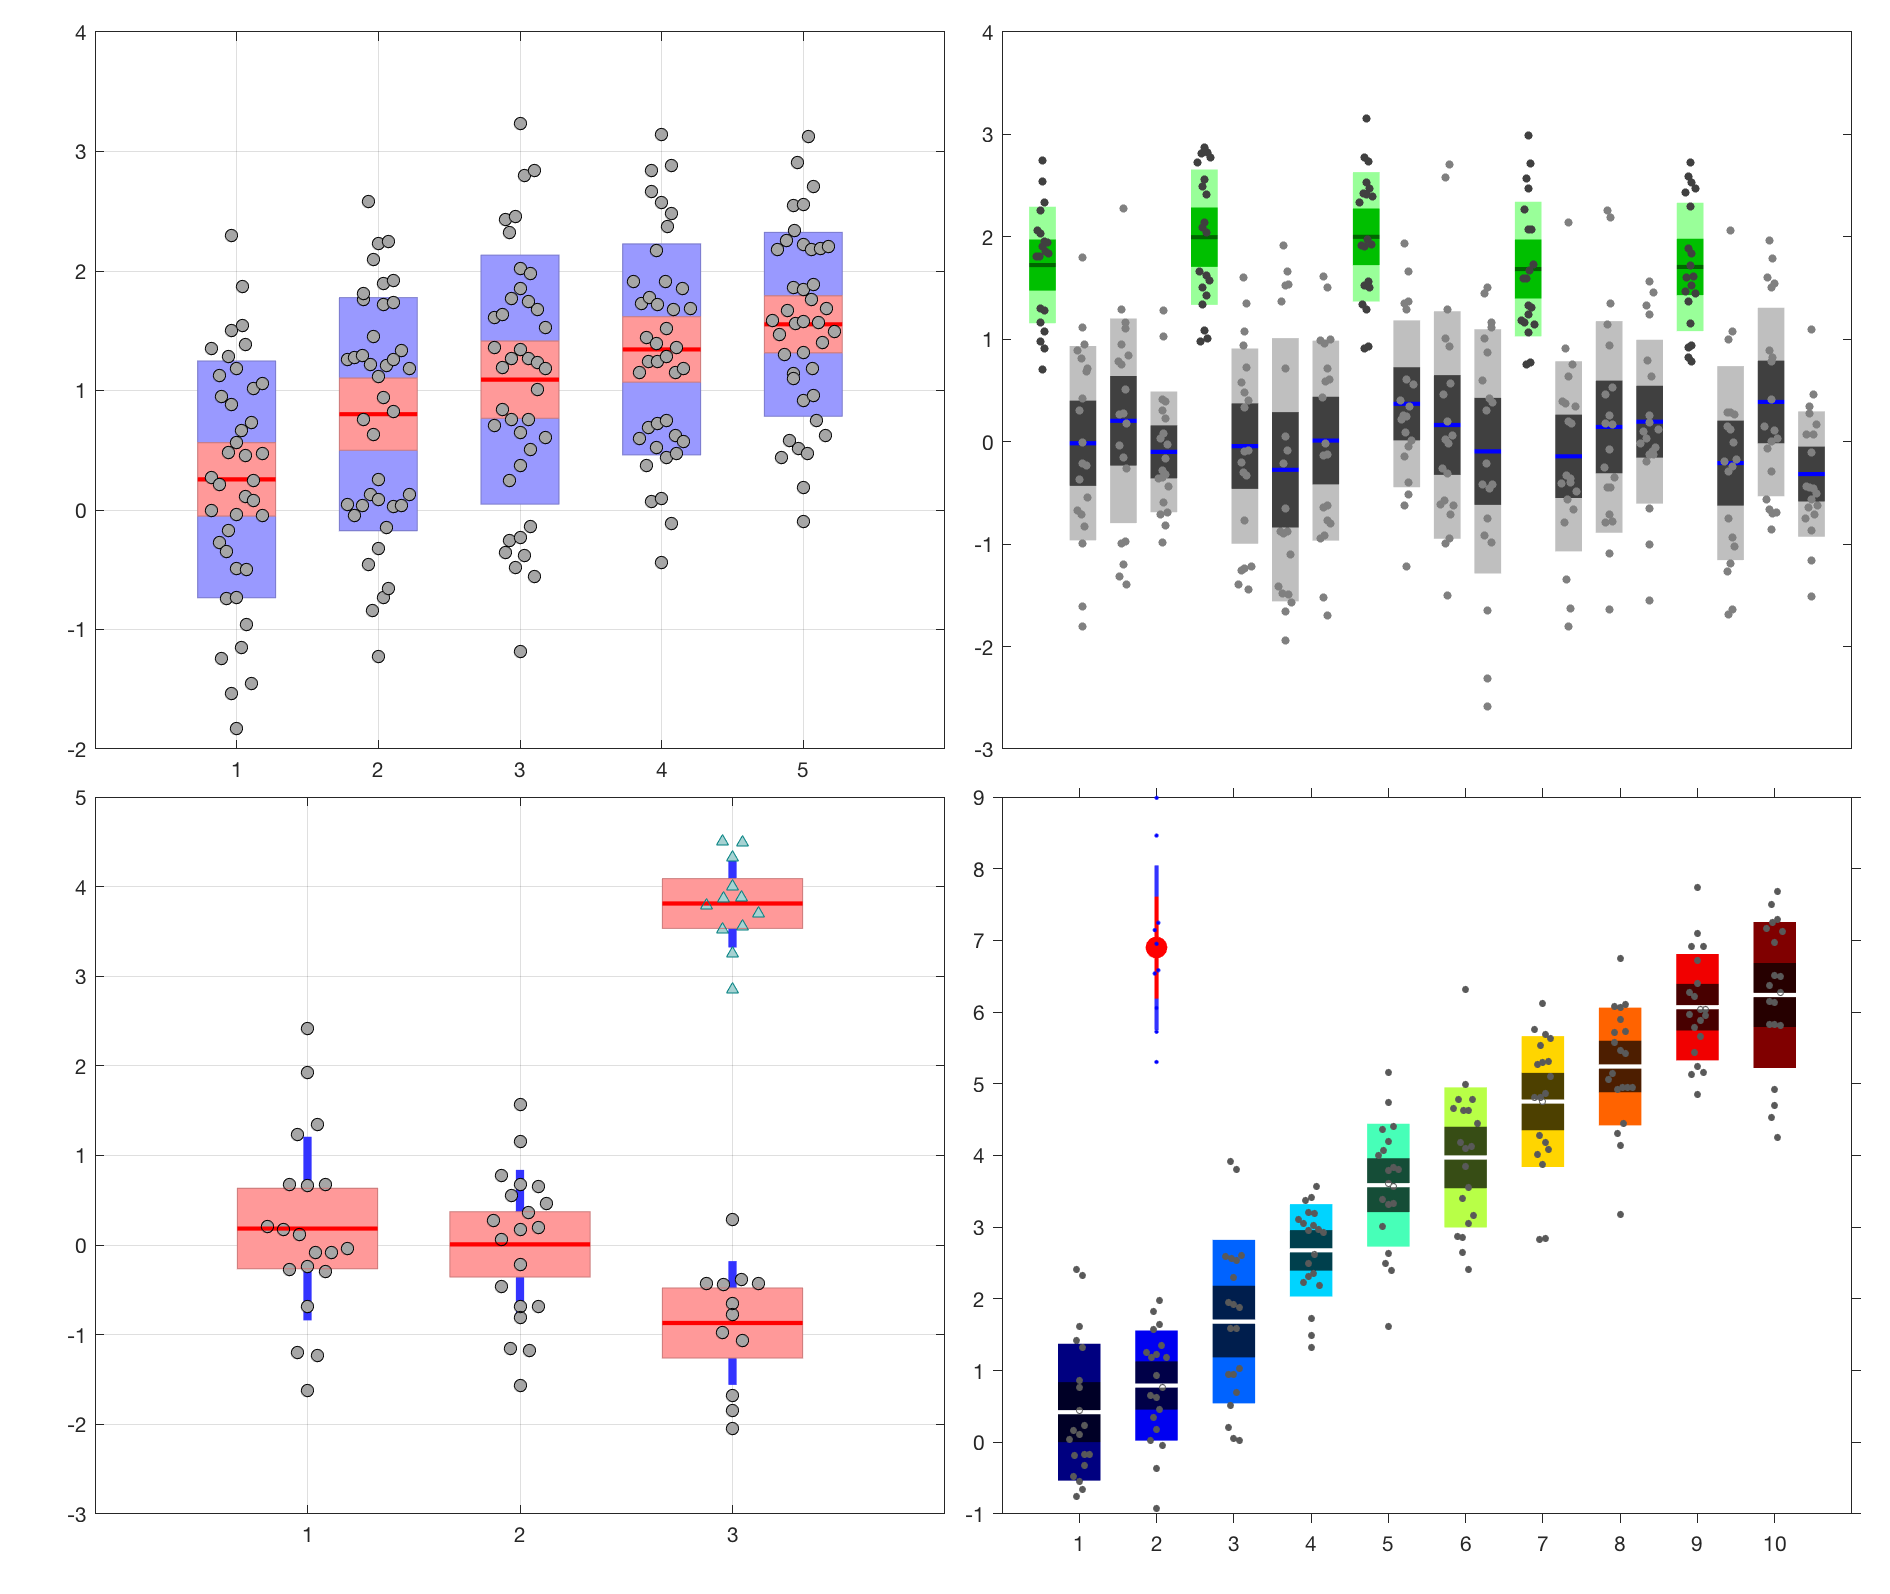
Whilst box plots have their place, it's sometimes nicer to see all the data, rather than hiding them with summary statistics such as the inter-quartile range. This function (with a tongue in cheek name) addresses this problem. The use of the mean instead of the median and the SEM and SD instead of quartiles and whiskers are deliberate. Jittered raw data are plotted for each group. Also shown are the mean, and 95% confidence intervals for the mean. This plotting style is designed to be used alongside parametric tests such as ANOVA and the t-test. Comparing the jittered data to the error bars provides a visual indication of whether the normality assumptions of the statistical tests are being violated. Furthermore, it allows one to eyeball the data to look for significant differences between means (non-overlapping confidence intervals indicate a significant difference at the chosen p-value, which here is 5%). Also see: http://jcb.rupress.org/cgi/content/abstract/177/1/7 Finally, 1 SD is also shown. Note that if data are not normally distributed then these statistics will be less meaningful.
The function has several examples and there are various visualization possibilities in addition to those shown in the above screenshot. For instance, the coloured areas can be replaced by lines.
Although it's worked well for situations I've needed it, I will be happy to modify the function if users come up against problems.
- Directly plot LinearModel objects from
fitlm[NEW] - Easily mix a variety of plot styles on one figure
- Easy post-hoc modification of plot parameters via returned function handles
- Statistics (mean, SD, etc) optionally returned
- Optional plotting of median in addition to mean
- Option to plot either a 95% confidence interval for the mean or a 95% t-interval
Q: "How can I modify the plot to look like..."
A: Most modifications can be done using the function handles. See the function help and the example function, NBP_example
- notBoxPlot.m - generates plots as shown in screenshot
- NBP.SEM_calc.m - calculate standard error of the mean. Provided as a separate function file so that it can be used for other purposes.
- NBP.tInterval_calc.m - calculate a t-interval. For small sample sizes, the t-interval is larger than the SEM. Provided as a separate function file so that it can be used for other purposes.
- NBP.example - makes a nice example plot
Add the code directory to your MATLAB path. Some operations (such as t-interval calculation) depend on the Stats Toolbox.
v1.31 (28-11-17)
- Bugfix to SEM and t-interval calc functions that caused errors to be pooled when fed a matrix rather than a vector
- Jitter is no "violin-like" so it scales with point density in Y. Looks neater.
v1.3 (11-03-17)
- Remove legacy calls
- Allow passing of a table, which automatically labels the axes
- Pass a LinearModel, which automatically labels the axes and uses the model errors
- Examples are now in separate files and doc text is neater
- User can now optionally do
notBoxPlot(y,'jitter',0.5)instead ofnotBoxPlot(y,[],'jitter',0.5)
v1.2 (28-08-16)
- Add median to plots
- Select SEM or t-interval from command line
- Return stats as second output
- Move to parameter/value pairs by default and warn user if they aren't doing this.
- Add unit tests.