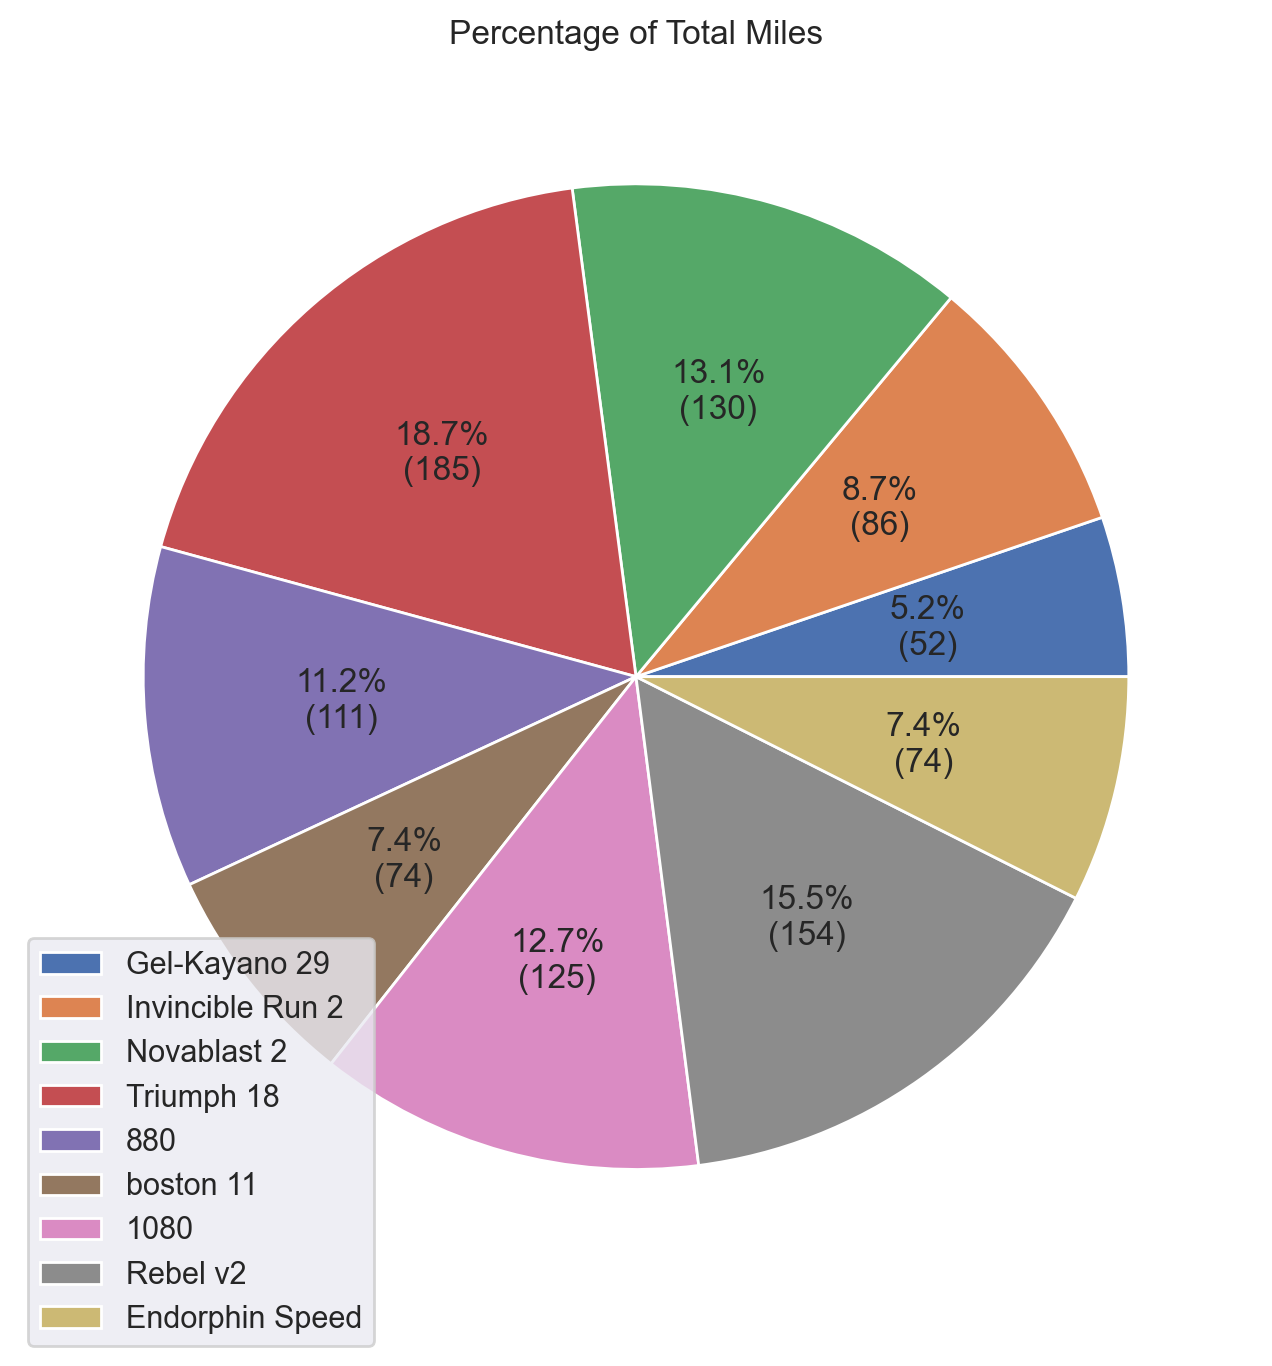
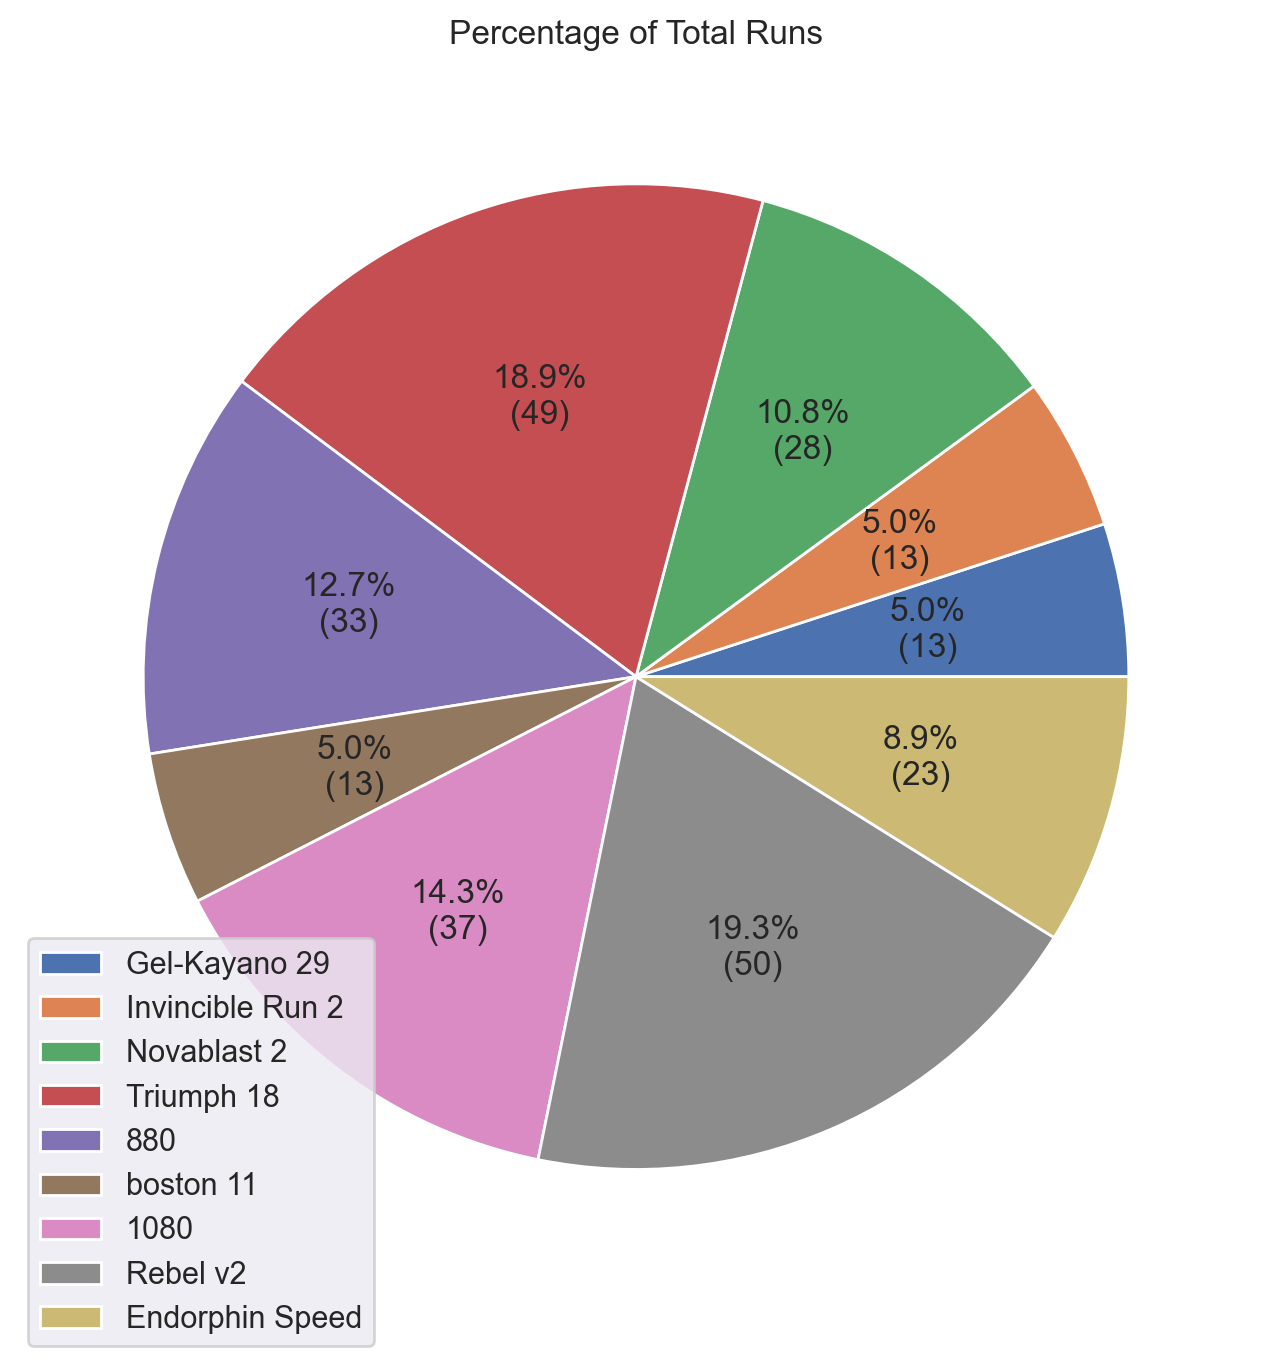
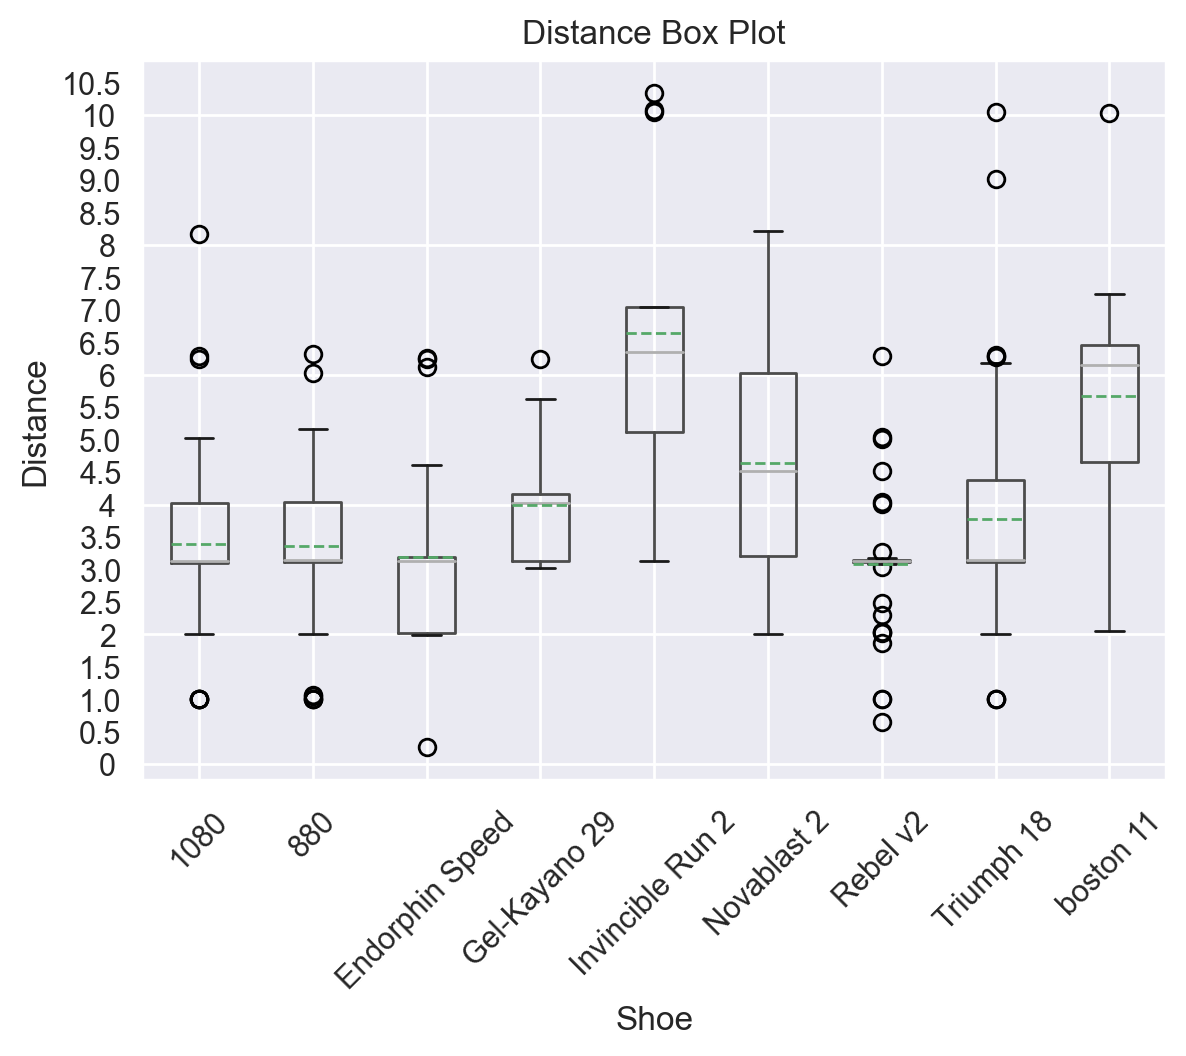
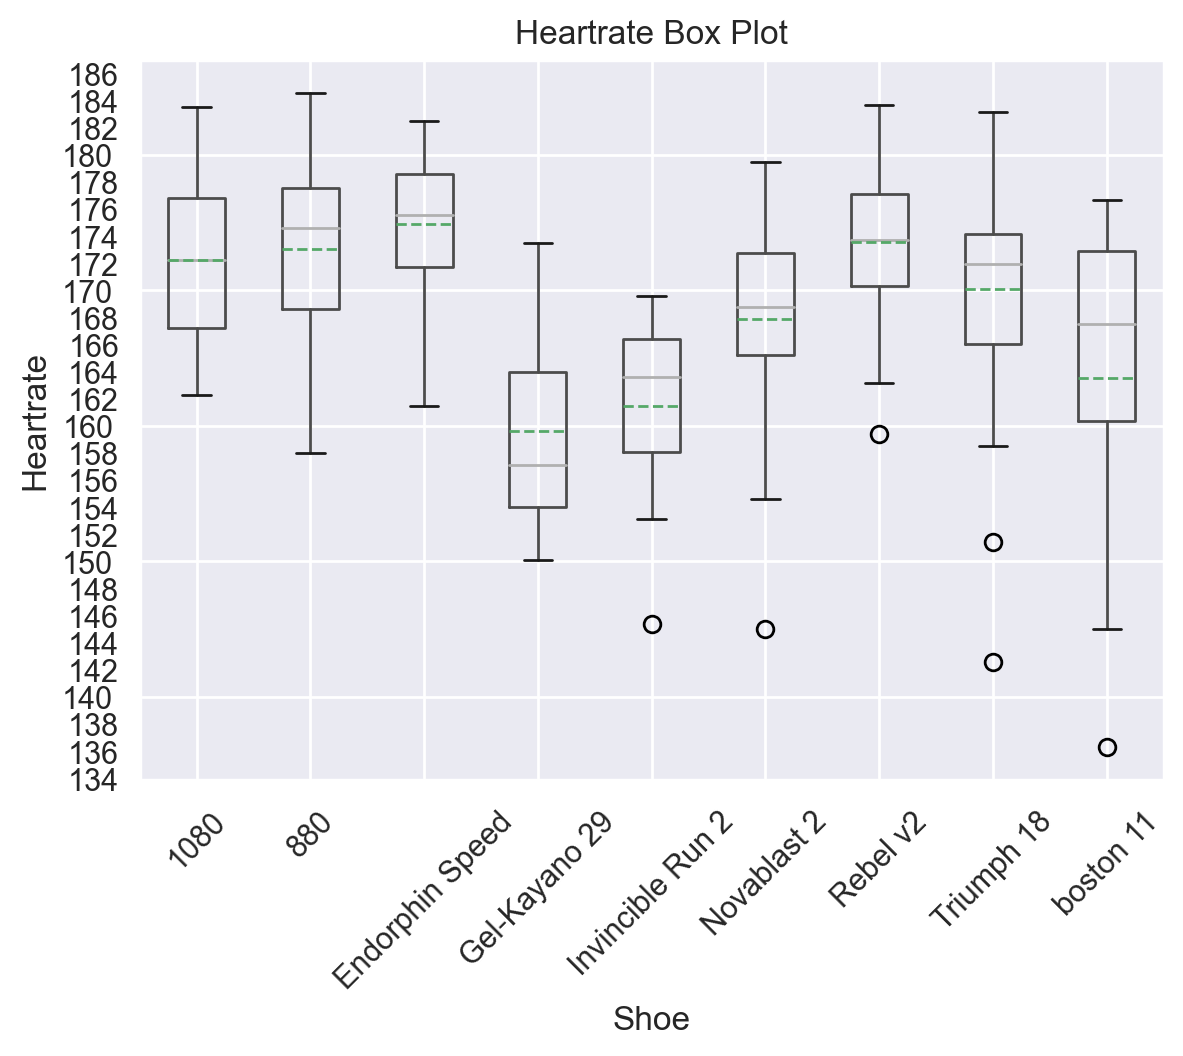
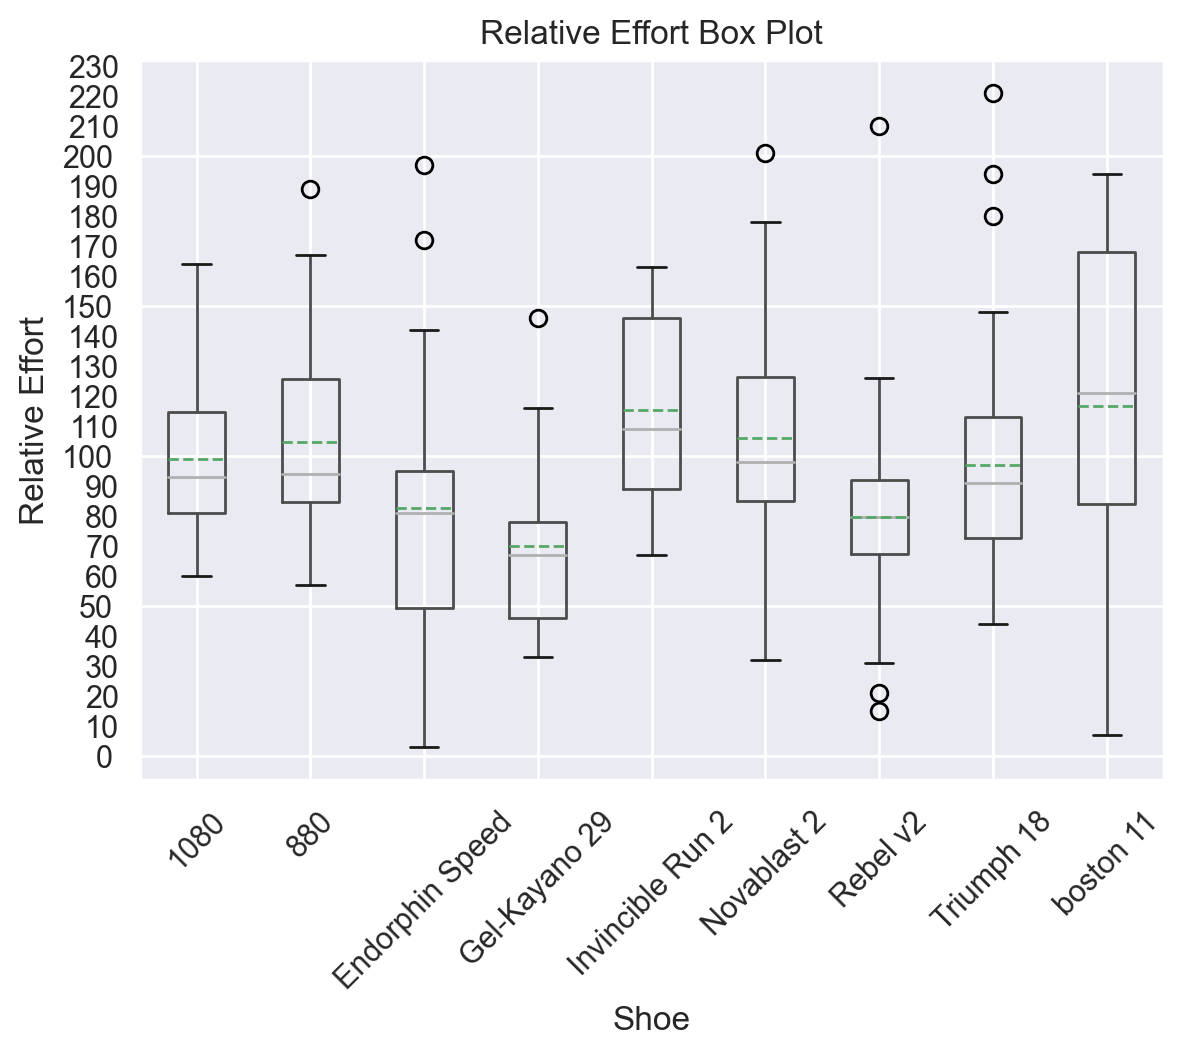
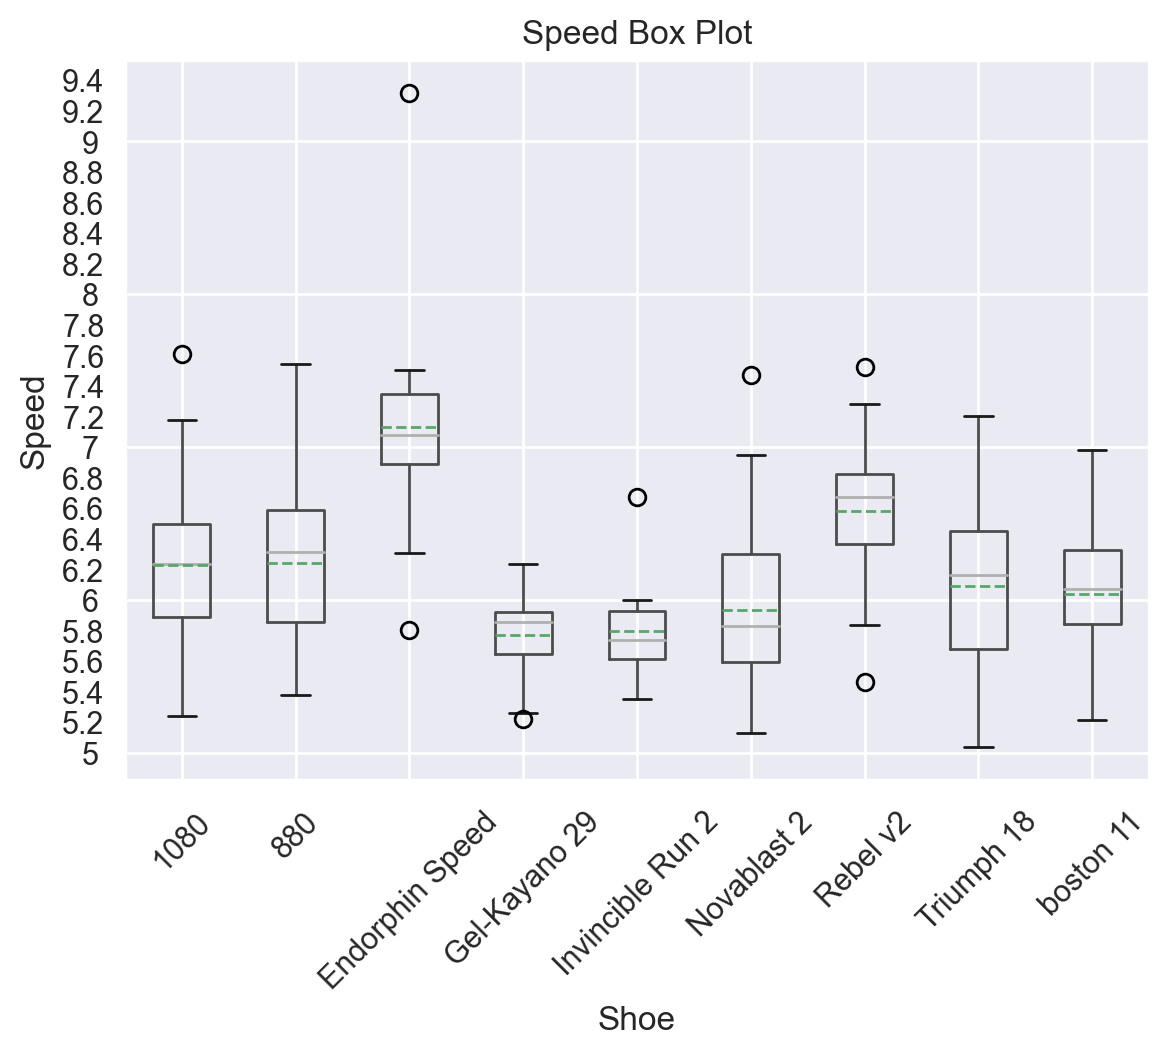
This is a simple Python program for reading activity data from the Strava API, grouping those activities by the gear used during the activity and making some simple visualizations about that gear. This program is designed to create visualizations using data from running activities, and it assumes the type of gear used are running shoes. I am sure it could be repurposed for any supported exercise and gear types, but, in its current state, that is not its scope.
In order to run this program, you'll need:
- A Strava account.
- At least one activity recorded on that Strava account and one saved piece of gear associated with that activity.
- A personal API application on that Strava account.
- and the corresponding
client_id,client_secretandrefresh_tokenfor that API application.
- and the corresponding
Below instructions are provided for creating a personal API application and retrieving the necessary values to run this program. Please note that, in the settings for your personal API application, you will find a refresh token; however, that is not a substitute for the steps below describing how to retrieve a refresh token for use by this program. The token provided in the settings page for your personal application only has read access, and this program requires a token with read all access.
- Create an API Application on Strava at https://www.strava.com/settings/api and set the Authorization Callback Domain to localhost
- Navigate back to https://www.strava.com/settings/api and you should see Client ID, Client Secret, Your Access Token, and Your Refresh Token
- Replace the values in the following template with the appropriate values from your API application's settings page and navigate to the URL in a browser:
https://www.strava.com/oauth/authorize?client_id=[your_client_id]&response_type=code&redirect_uri=http://localhost/exchange_token&approval_prompt=force&scope=activity:read_all - Copy the code provided in the URL after authorizing your app. The URL should look like
this:
http://localhost/exchange_token?state=&code=[CODE]&scope=read,activity:read_all - Make the following GET request either from the commandline or a GUI like Postman or HTTPie:
curl --request POST \
  --url 'https://www.strava.com/oauth/token?client_id=[your_client_id]&client_secret=[your_client_secret]&code=[CODE]&grant_type=authorization_code'
- Your refresh token will be in the response as
"refresh_token"
Once you have your refresh_token, client_secret and client_id ready, you can either replace the values
in the payload array with your values or add them to the login.example.py file and remove the "example" from the
file name. The login file is imported in the main program and its values are inserted into the payload
via f-strings.
payload = {
    'client_id': f'{login.client_id}',
    'client_secret': f'{login.client_secret}',
    'refresh_token': f'{login.refresh_token}',
    'grant_type': "refresh_token",
    'f': 'json'
}
- I want to caveat that this data is not necessarily revelatory. First, it's often self-evident. It's a self-fulfilling prophecy the shoe you bought for interval training is the shoe with the highest average speed for example. Second, there are a lot of qualitative data points such as "how were you feeling that day?" or "do you only use this shoe for a certain type of work out?". Where this data might be useful is in making comparisons between shoes with similar usage profiles and looking for slight performance differences over time. However, it's most likely only useful in serving as a confirmation of your training regimen and gear selection and identifying outlier performances/usage. My main goal was to spread awareness of the Strava API and potential uses for it.
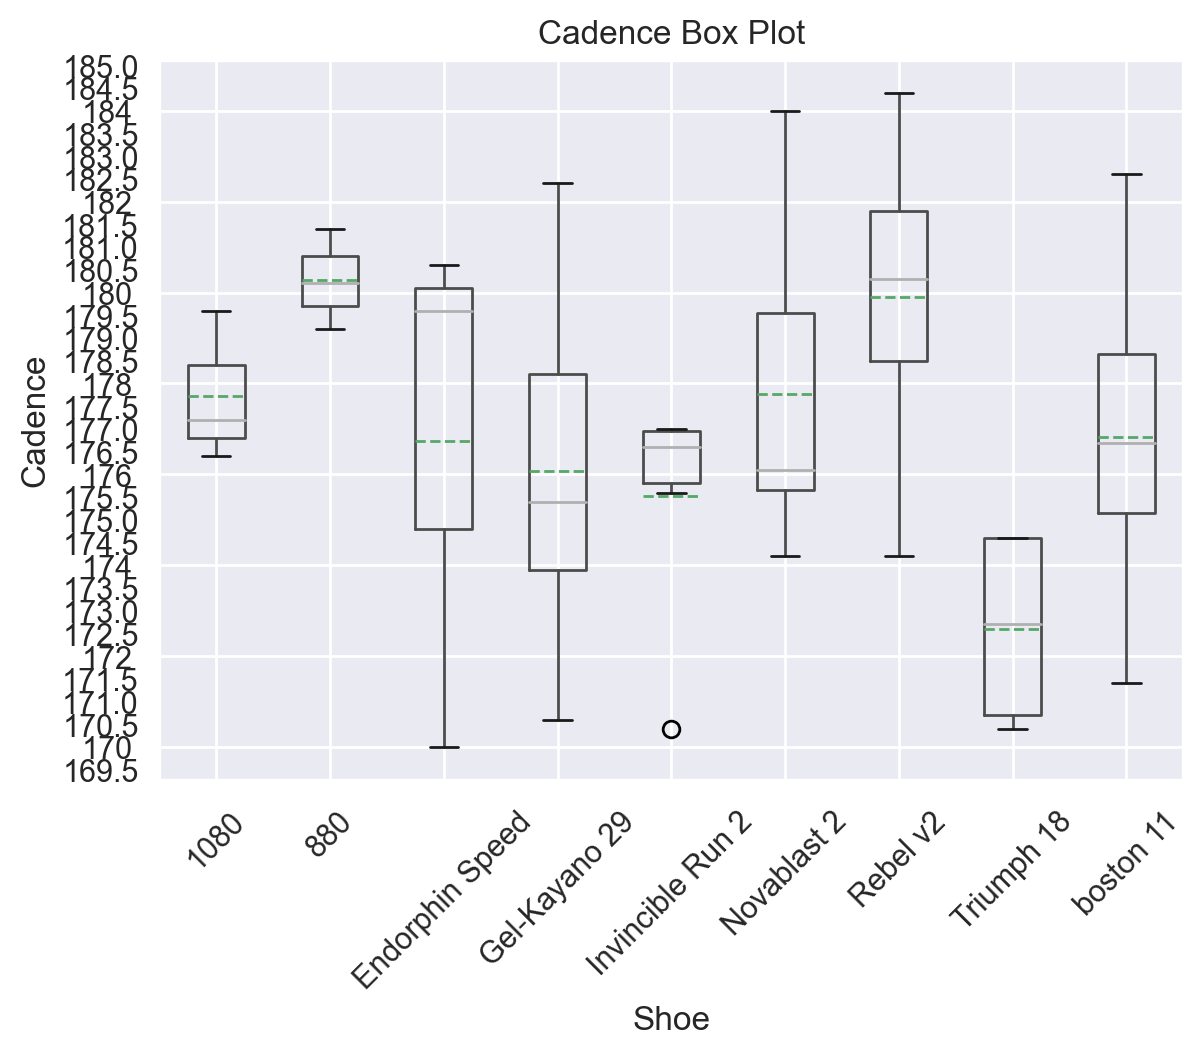
- The box plots can be read as followed:
- Dotted Lines: Mean
- Solid Line: Median (Q2 quartile)
- Rectangle: Q1 - Q3 quartiles
- Whiskers: Range
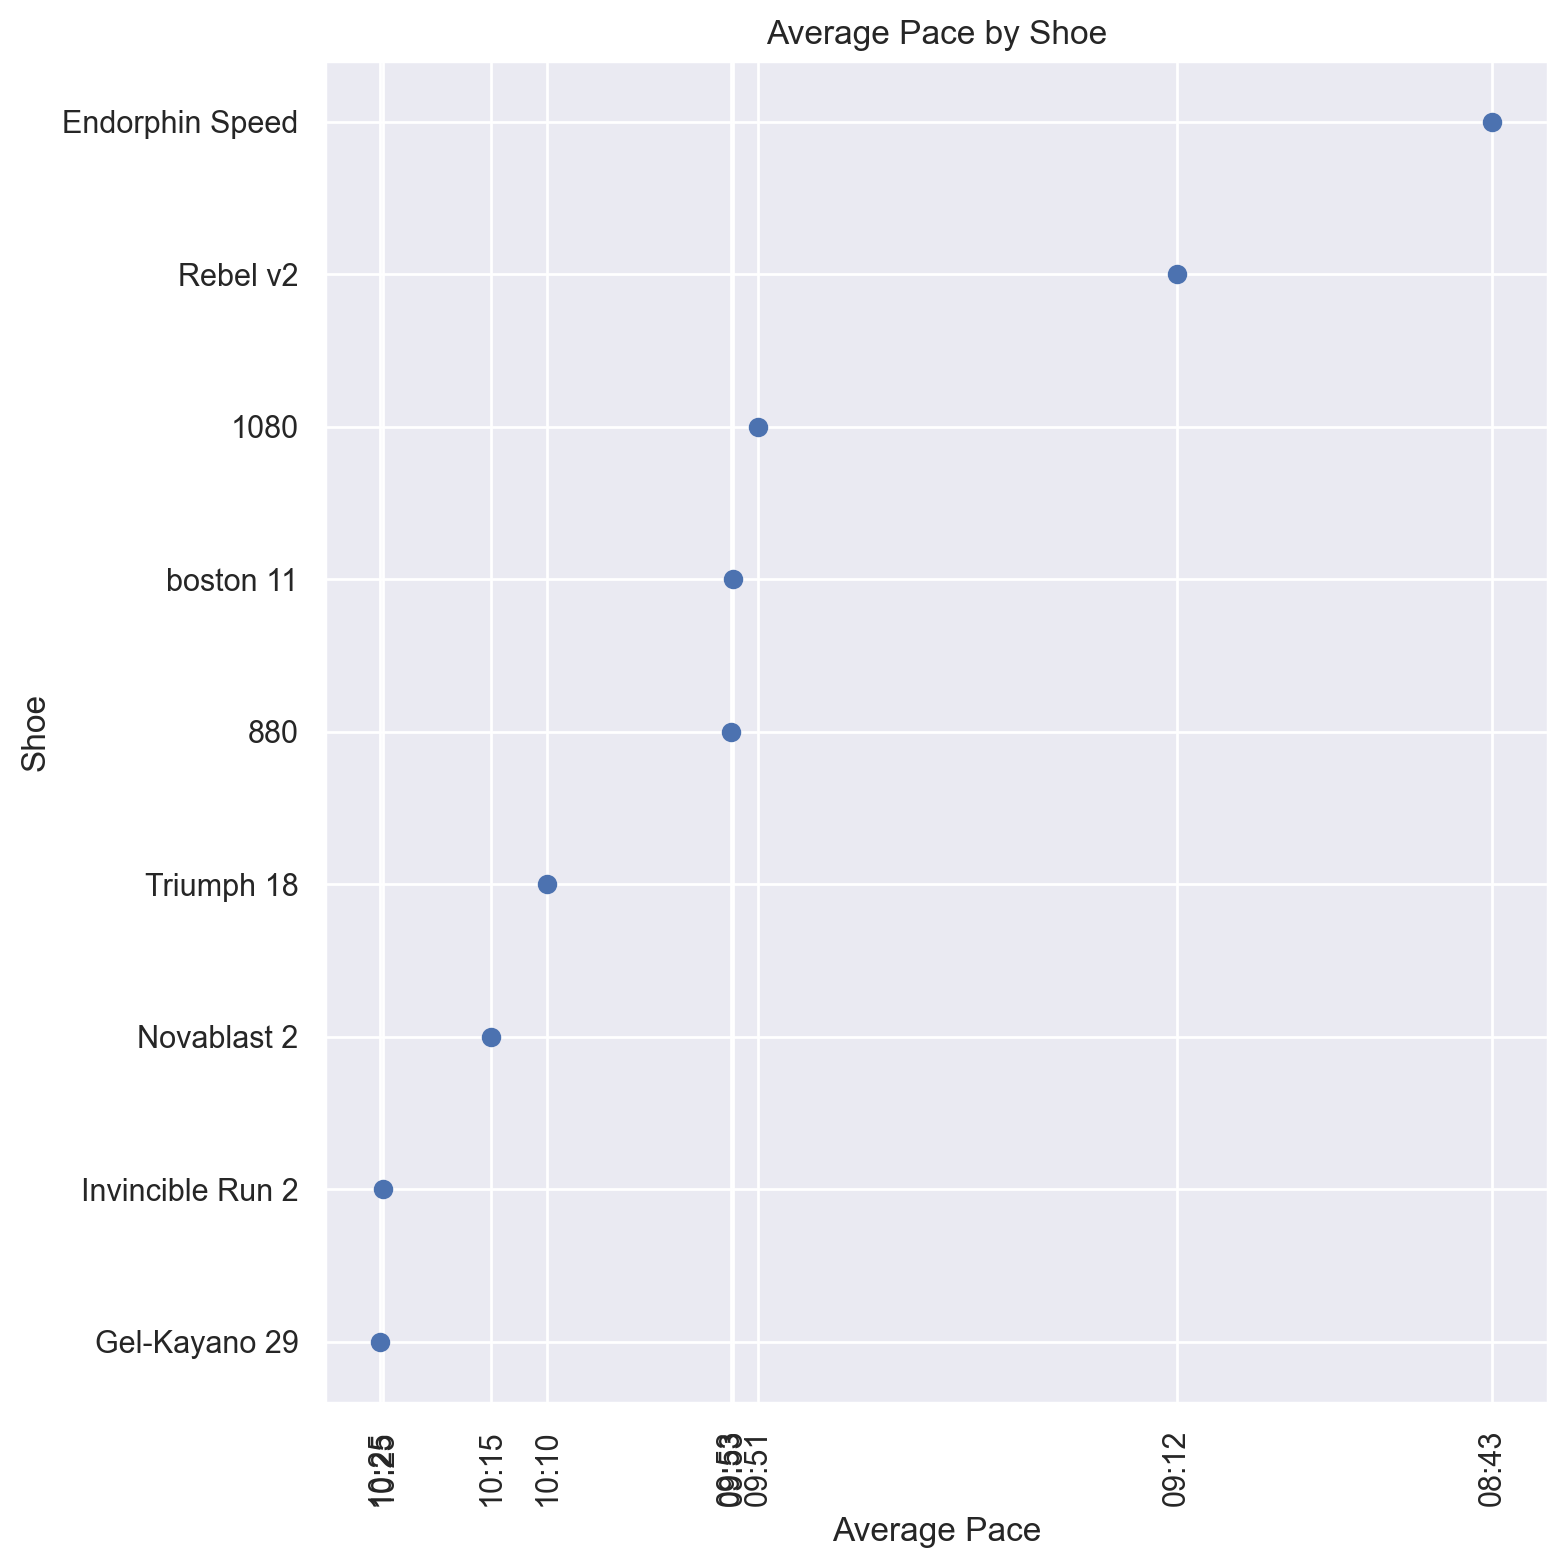
- Mean (average) is a bit tricky in some places (such as speed) due to calculating "average of averages". This is why the additional data provided by the boxplot is useful, e.g., median and range.
- Some weighted averages could be useful for several metrics (potential roadmap item).
- "Average Pace" is calculated by the total moving time / total miles on a shoe.
- The program will filter out any shoes that have less than 50 miles on them or are "retired" in the Strava UI. You can modify the code here to change this behavior:
    if model['retired']:
        shoes_removed.append(model['model_name'])
for index, row in df2.iterrows():
    x = row['distance']
    y = index
    z = row['gear_id']
    if x <= 50:
        shoes_removed.append(z)
- The program will look up all of your shoes for all time. If you'd like to set a date range, you can modify the
activitiesvariable with Strava's supported date params. Example:
activities_url = "https://www.strava.com/api/v3/athlete/activities?before=1691630694&after=1690853094"
- Strava does rate limit the amount of requests you can make to 100 requests per 15 minutes and 1000 requests per day. You can check your usage in your API application dashboard.
- I admittedly haven't spent much time styling these charts. You may encounter ugly behavior when you reach a certain number of shoes.
