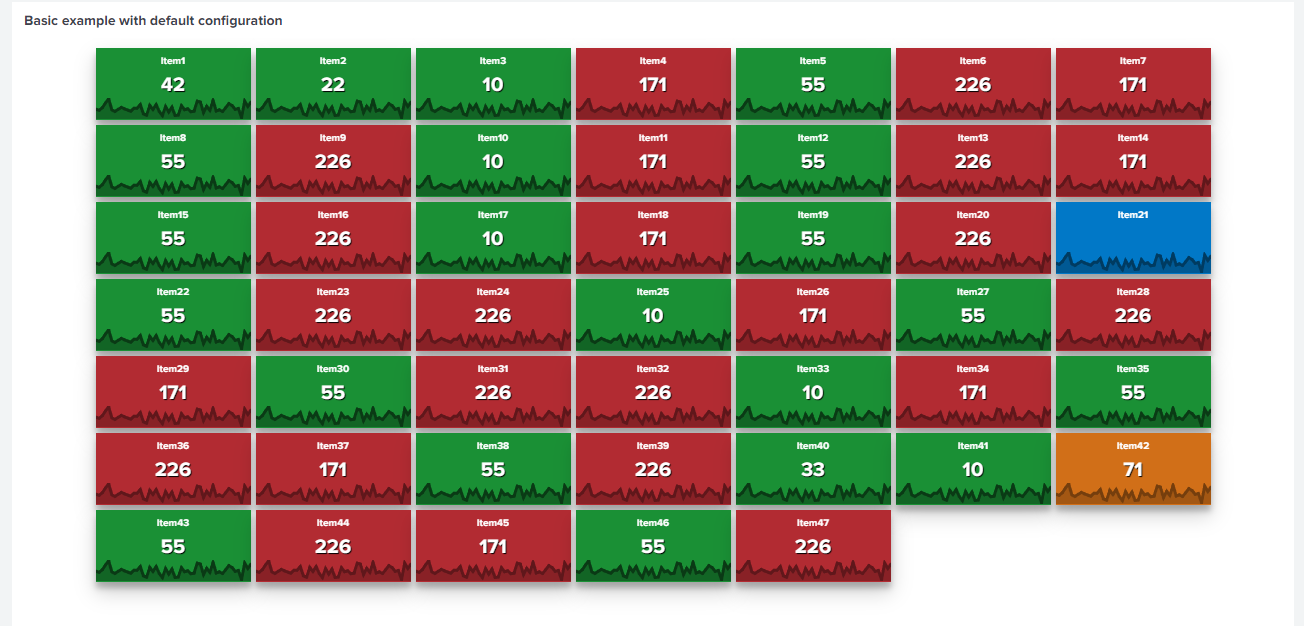
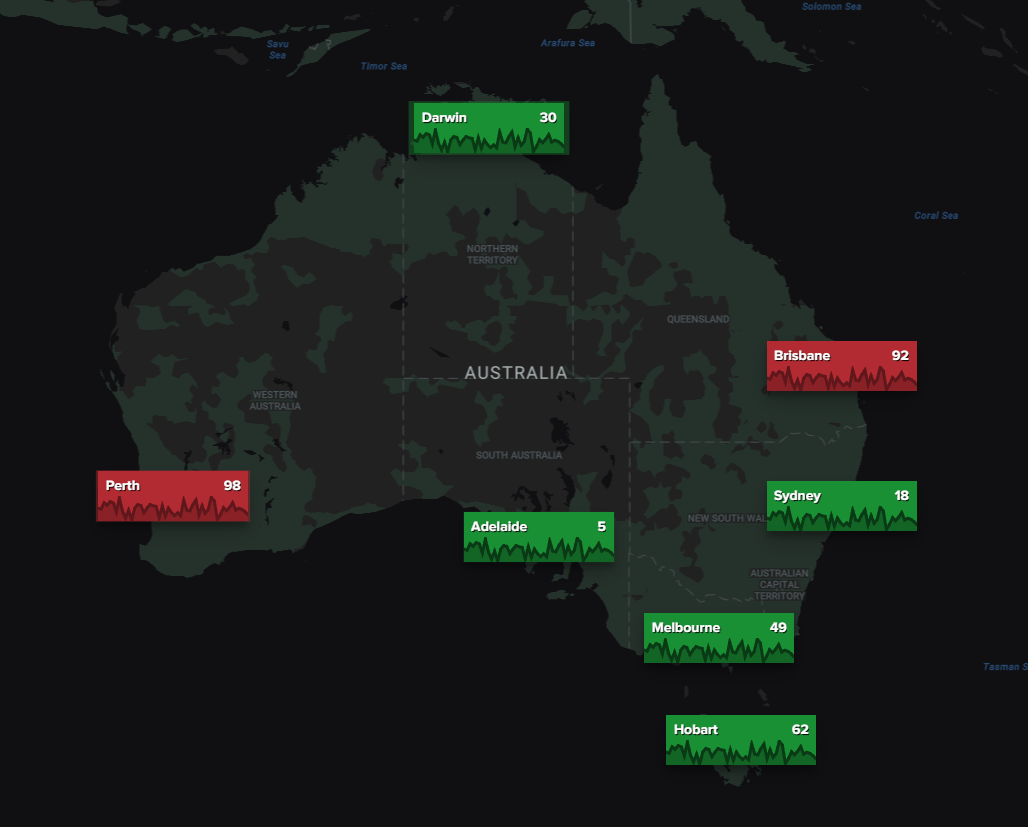
A visualization for displaying a collection of numbers either as an auto-sizing grid or absolutly positioned - typically over a background image. Each item can include a graph showing values overtime.
Copyright (C) 2023 Chris Younger | Source code | Splunkbase | Questions, Bugs or Suggestions | My Splunk apps
Please see the documentation on the Splunkbase application page or use the in-product documentation.