Heatgrid viz
Configurable Heat Grid / Heatmap visualization that can be used to show the quick status or health of many items at once. Support for grouping, and can display as hexagons, squares, diamonds or circles. Fully customisable tooltips, drilldown support, and numerous color schemes. Works in dark-mode.
Copyright (C) 2021 Chris Younger | Splunkbase | Source code | Questions, Bugs or Suggestions | My Splunk apps
Usage
This visualisation expects data with specific field names. Use | rename to make sure your fields match what is expected. Every row of data will become a cell in the heatgrid. Data must always have "value" or "color" field (not both). If the "value" field is provided, the color will be automatically set based on the selected color gradiant. It is also possible to explicitly set color in the data by providing a "color" field.
some search... | table value tooltip group
See the in-app documentation for other field names that are supported
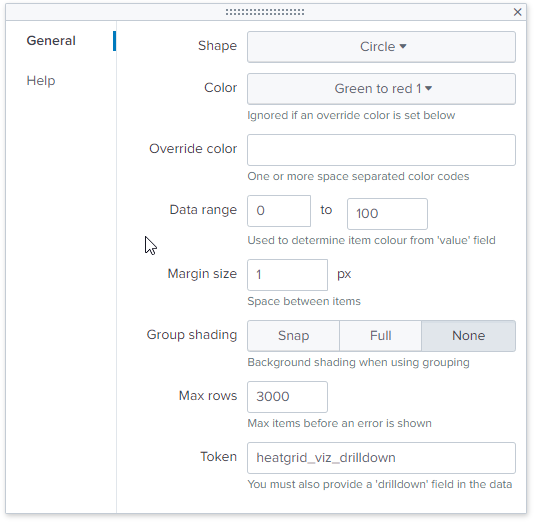
Formatting options
Third party software
The following third-party libraries are used by this app. Thank you!
- jQuery - MIT - https://jquery.com/
- D3 - BSD 3-Clause - https://d3js.org/
- Font Awesome - Creative Commons Attribution-ShareAlike 4.0 License - https://fontawesome.com/

