To use this visualization, start with the following search:
|makeresults
See below for more examples of searches that add text, icons and clock overlays to the visualization.
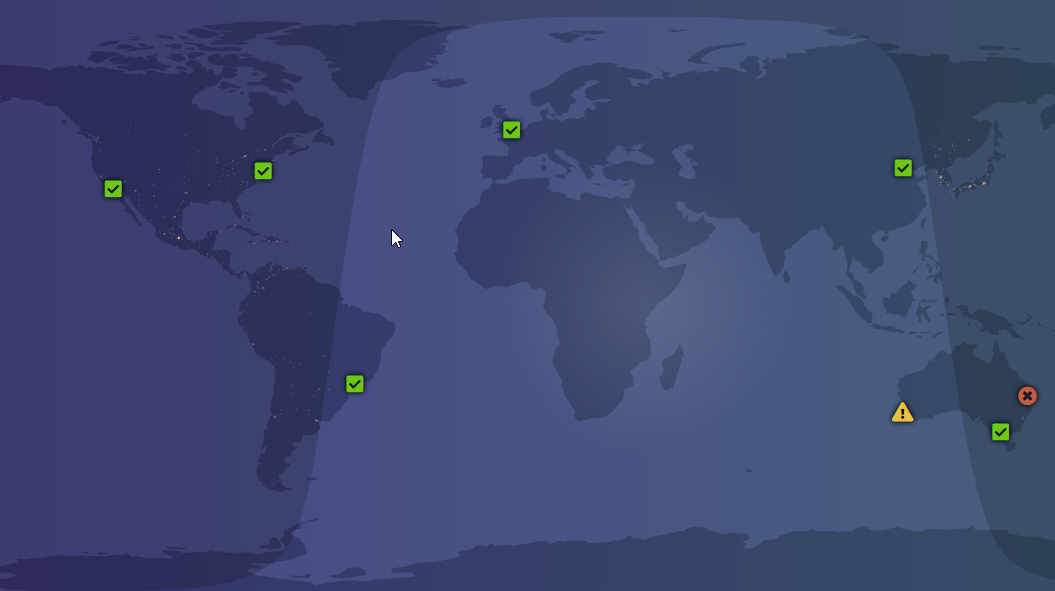
A table of data can be provided to this visualization to render overlays on the map. Either lat/lon or x/y must exist for each row.
| Field | Valid values | Description |
|---|---|---|
lat |
-180 to +180 |
Latitude coordinate for the overlay item. |
lon |
-180 to +180 |
Longitude coordinate for the overlay item. |
x |
0 to 100 |
The X coordinate as a percentage (0=left, 100=right). |
y |
0 to 100 |
The Y coordinate as a percentage (0=top, 100=bottom). |
type |
icon, text, clock |
The overlay type |
content |
text | When type=text this is the text content (can contain HTML). When type=icon this is the icon class (see section below). When type=clock this is the sub-text content. |
size |
0 + |
(Optional) A multiplier of the default size for this item. |
color |
Valid css color | (Optional) Color of the item. |
tooltip |
text | (Optional) A tooltip to display on mouse hover (can contain HTML). |
timezone |
ISO timezone | (Optional) The timezone for the clock https://en.wikipedia.org/wiki/List_of_tz_database_time_zones Can also be specifed as exact offset, e.g. etc/GMT+5:00 |
shadow |
0 to 1 |
(Optional) Drop shadow opacity of the item. Set 0 for no shadow. |
weight |
normal, bold |
(Optional) Font-weight (clock and text types only). |
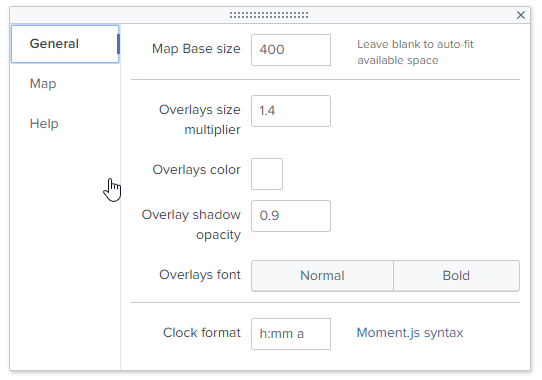
The default options for overlays are configured in the visualization formatting options:
Any icon from the FontAwesome v5 Free icon sets can be used. The complete list is here: https://fontawesome.com/cheatsheet/
The "solid" icon set is the default, but the "regular" set can be used by prefixing far fa-*
Below are a list of the more useful icons that are available.
![]()
Clocks across top. (using x/y positioning)
| makeresults
| eval raw = "
x=17, y=12, type=clock, content=Pacific, timezone=America/Los_Angeles ###
x=29, y=12, type=clock, content=Eastern, timezone=America/New_York ###
x=50, y=12, type=clock, content=UTC/GMT, timezone=UTC ###
x=73, y=12, type=clock, content=IST, timezone=Etc/Gmt+5 ###
x=90, y=12, type=clock, content=AEDST, timezone=Australia/Sydney ###
"
| makemv delim="###" raw
| mvexpand raw
| rename raw  as  _raw
| extract
Clocks at locations, with different colors and sizes.
| makeresults
| eval raw = "
lat=-27.3818631, lon=152.7130211, type=clock, content=Brisbane, timezone=Australia/Brisbane, size=0.8 ###
lat=51.5285582, lon=-0.2 416783, type=clock, content=London, timezone=Europe/London, color=#00cc00 ###
lat=39.372883, lon=-73.9391617, type=clock, content=\"New York\", timezone=America/New_York, size=1.5, color=#F1813F ###
lat=34.0203996, lon=-118.5518137, type=clock, content=\"Los Angeles\", timezone=America/Los_Angeles, color=#DC4E41 ###
"
| makemv delim="###" raw
| mvexpand raw
| rename raw  as  _raw
| extract
The following third-party libraries are used by this app. Thank you!
- jQuery - MIT - https://jquery.com/
- Moment.js - MIT - https://momentjs.com/
- World Daylight Map - MIT - https://github.com/pauljnoble/world-daylight-map
- D3.js - BSD 3-Clause "New" or "Revised" License - https://d3js.org/
- D3 Geocode Projections - BSD 3-Clause "New" or "Revised" License - https://github.com/mbostock/d3/wiki/Geo-Projections
- Topojson - BSD 3-Clause "New" or "Revised" License - https://github.com/mbostock/topojson
- Suncalc - BSD 2-Clause "Simplified" License - https://github.com/mourner/suncalc
- MaxMind cities - Creative Commons Attribution-ShareAlike 4.0 International License. - https://dev.maxmind.com/geoip/geoip2/geolite2/
- Font Awesome - Creative Commons Attribution-ShareAlike 4.0 License - https://fontawesome.com/