Adapted from the work published in IEEE Transactions on Medical Imaging (https://doi.org/10.1109/TMI.2022.3176598). This project showcases the inference capabilities of transformer-based models for healthcare applications. It has been adapted and developed during the Transformer hackaton @ LabLab.Ai
![]()
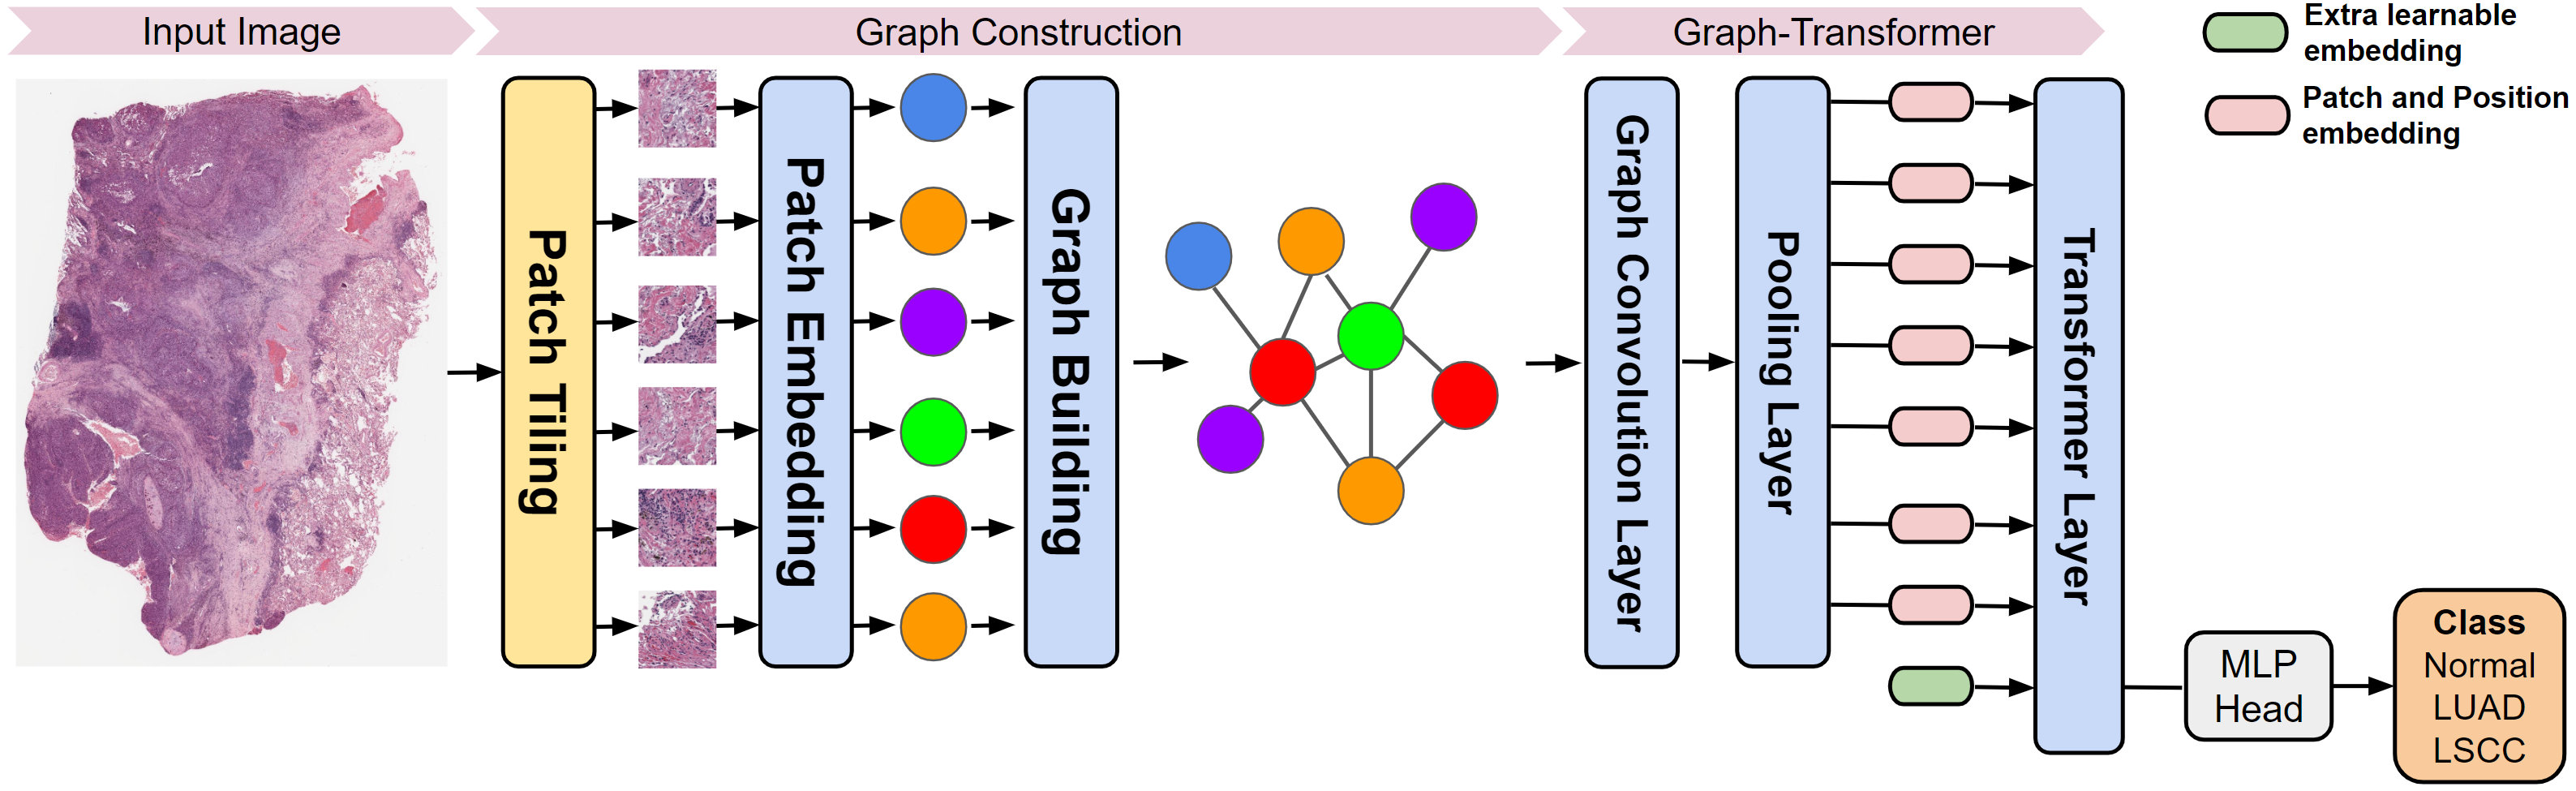
This repository contains a PyTorch implementation of a deep learning based graph-transformer for whole slide image (WSI) classification. The original authors proposed a Graph-Transformer (GT) network that fuses a graph representation of a WSI and a transformer that can generate WSI-level predictions in a computationally efficient fashion.
Start by setting the environment variables by running:
source ./set_env.shNote, for each shell it is necessary to re-run the above command, as it sets the environment variables only for the current shell.
Then, download the required datasets, the gdc tool and the main pip dependencies with:
./download_dataset_manifest.sh
./run_setup.shAt this point, the whole training pipeline can be run by means of:
./run_train_pipeline.shThe above is composed of four main steps:
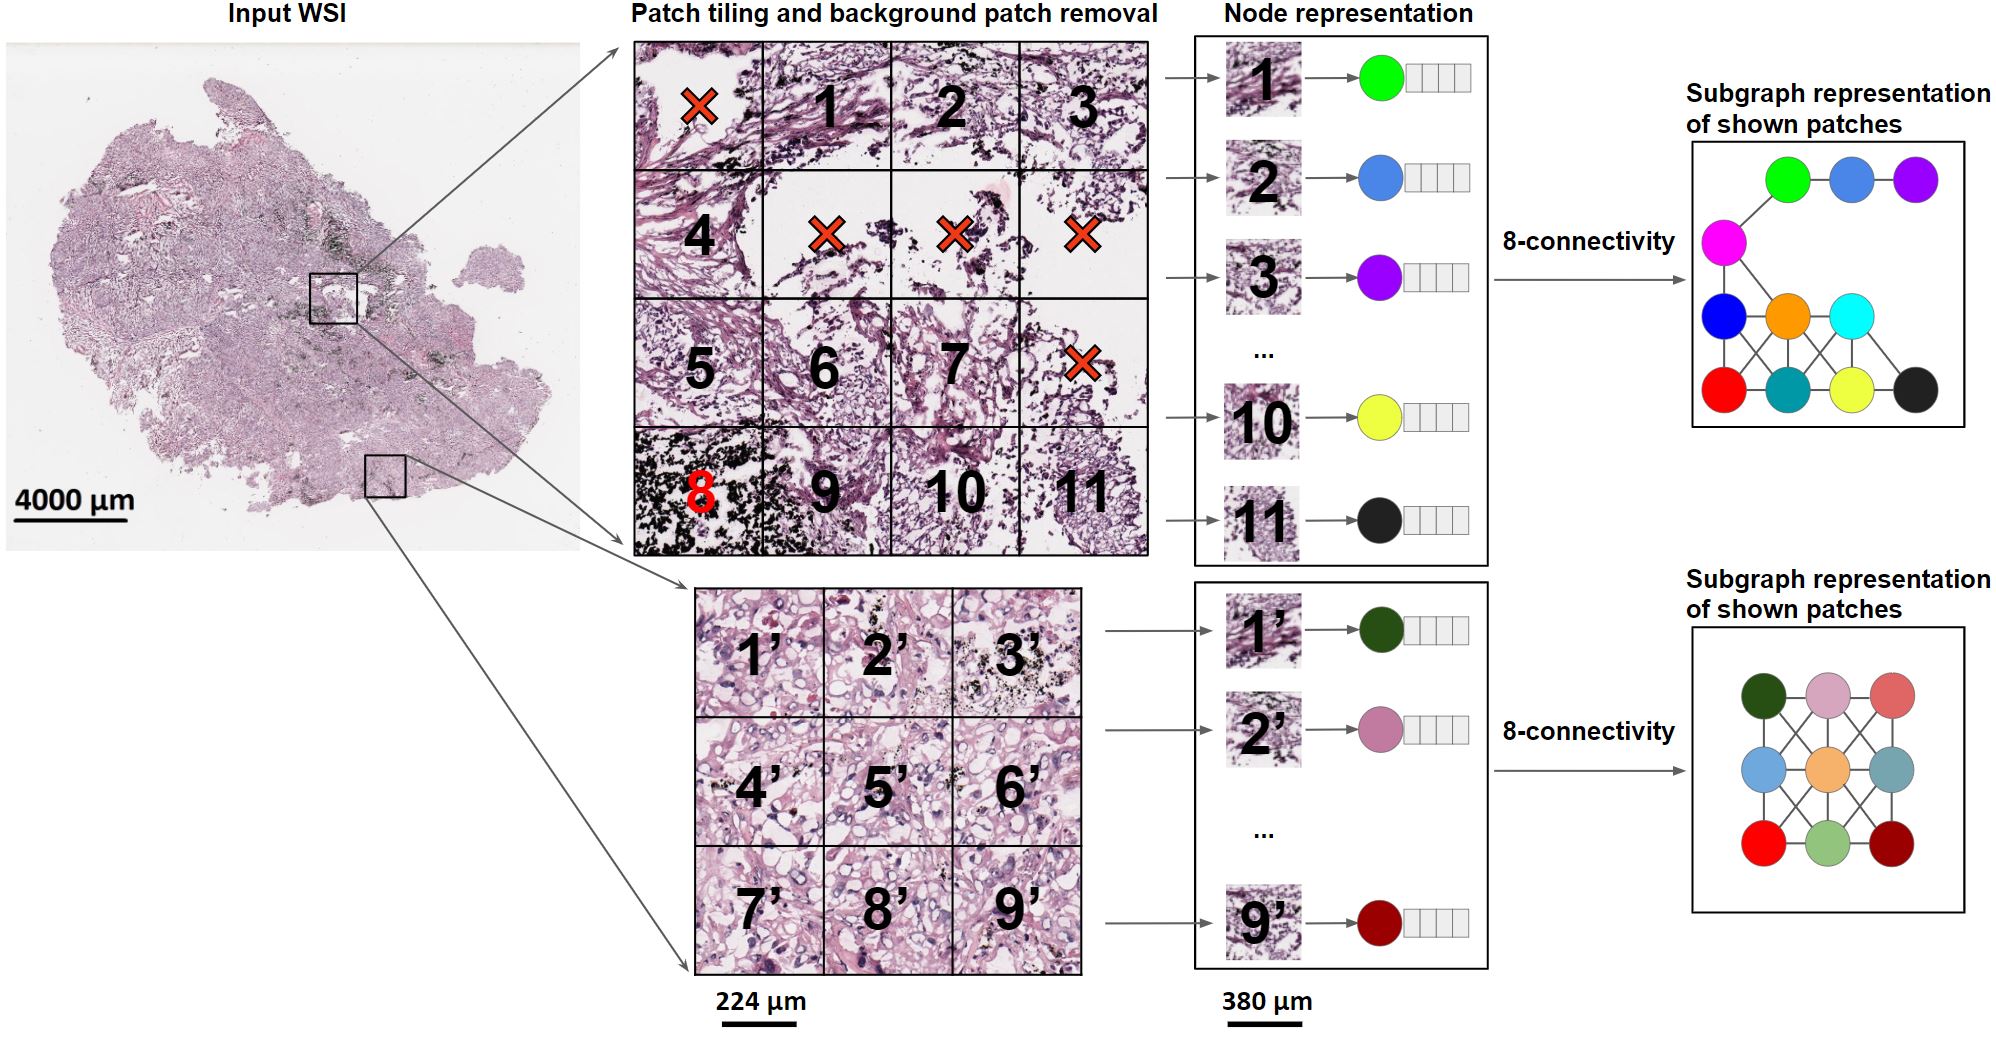
- extraction of patches from the original slide
- training of the patch feature extractor
- extraction of the graph of each patch obtained in step(1.) for a given slide, by means of the trained feature extractor
- training and testing of the Graph Transformer
Finally, after all training steps are completed, inference can be tested with the streamlit.py demo:
./run_streamlit.sh
python src/tile_WSI.py -s 512 -e 0 -j 32 -B 50 -M 20 -o <full_patch_to_output_folder> "full_path_to_input_slides/*/*.svs"
Mandatory parameters:
Go to './feature_extractor' and config 'config.yaml' before training. The trained feature extractor based on contrastive learning is saved in folder './feature_extractor/runs'. We train the model with patches cropped in single magnification (20X). Before training, put paths to all pathces in 'all_patches.csv' file.
python run.py
Go to './feature_extractor' and build graphs from patches:
python build_graphs.py --weights "path_to_pretrained_feature_extractor" --dataset "path_to_patches" --output "../graphs"
Run the following script to train and store the model and logging files under "graph_transformer/saved_models" and "graph_transformer/runs".
bash scripts/train.sh
To evaluate the model. run
bash scripts/test.sh
Split training, validation, and testing dataset and store them in text files as:
sample1 \t label1
sample2 \t label2
LUAD/C3N-00293-23 \t luad
...
To generate GraphCAM of the model on the WSI:
1. bash scripts/get_graphcam.sh
To visualize the GraphCAM:
2. bash scripts/vis_graphcam.sh
Note: Currently we only support generating GraphCAM for one WSI at each time.
More GraphCAM examples:
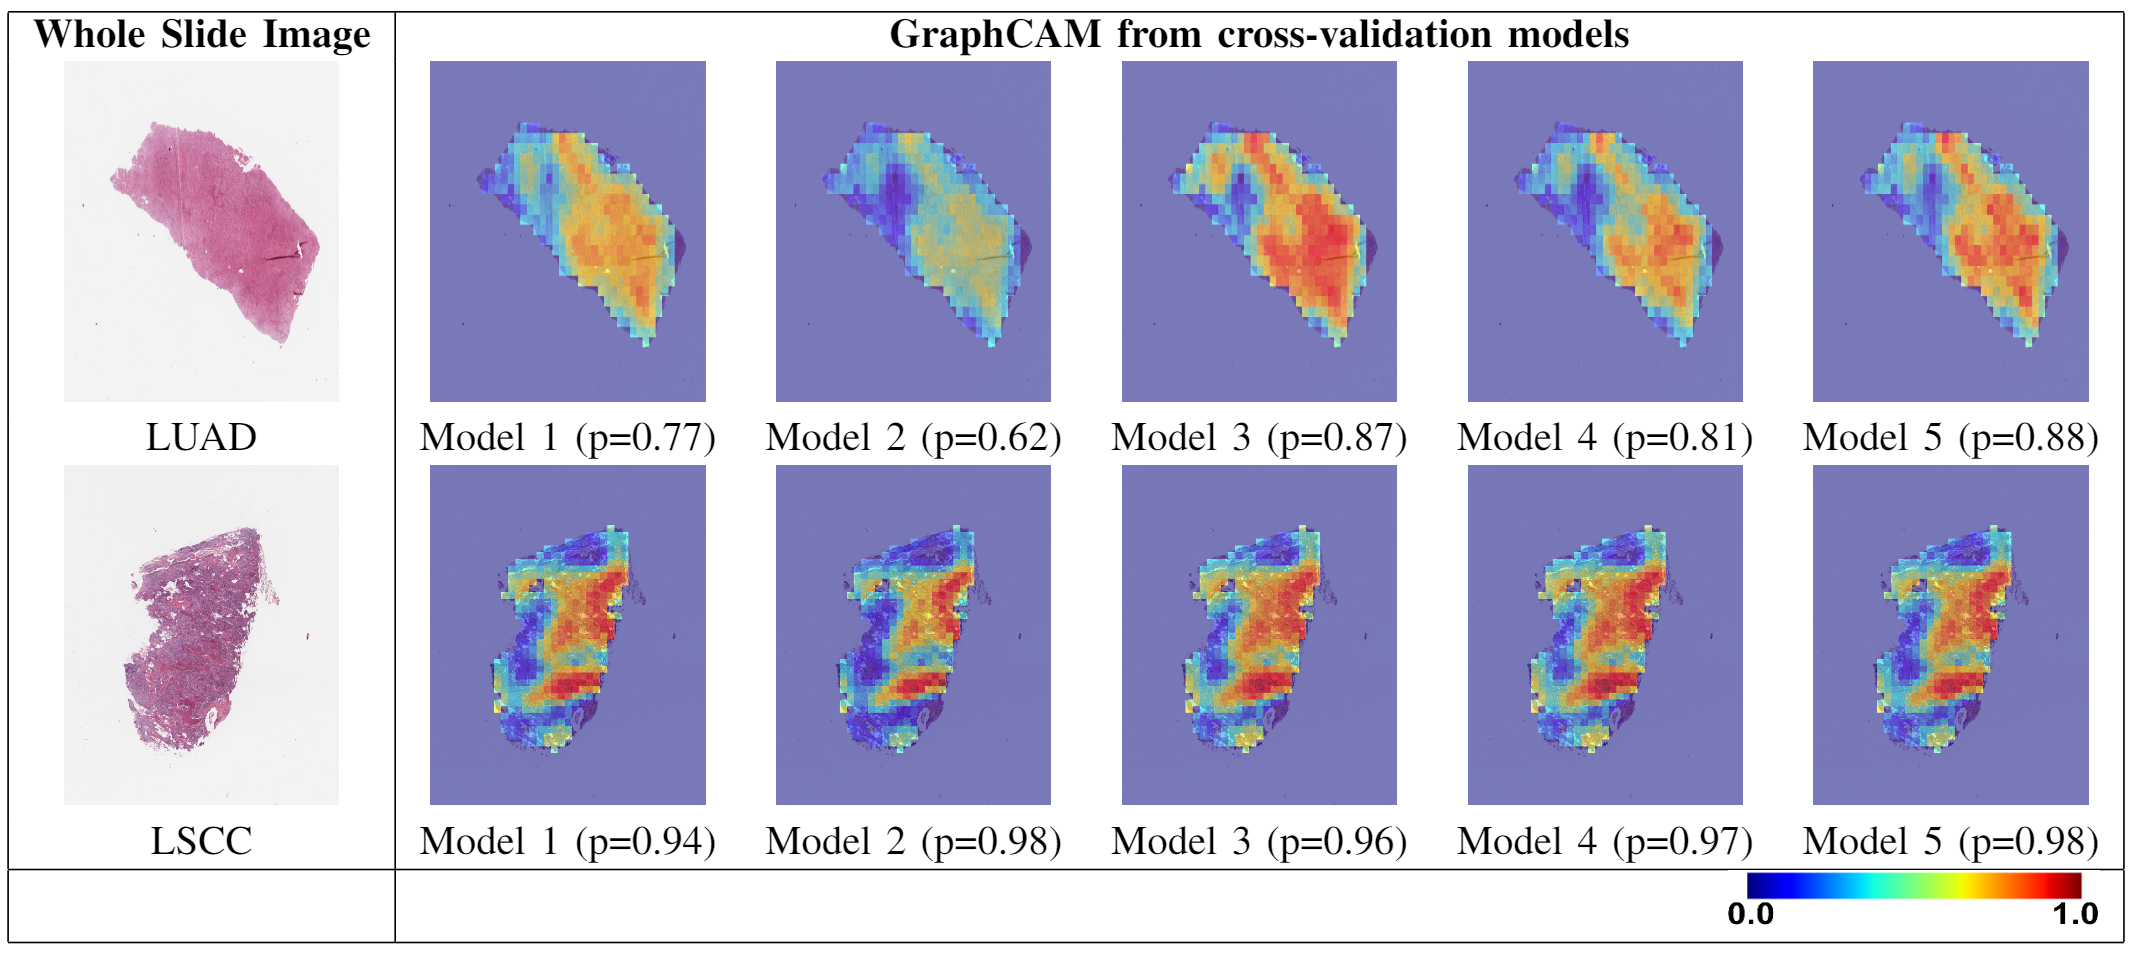
GraphCAMs generated on WSIs across the runs performed via 5-fold cross validation are shown above. The same set of WSI regions are highlighted by our method across the various cross-validation folds, thus indicating consistency of our technique in highlighting salient regions of interest.