An R package for Life Data Analysis
The anticipated re-packaging and augmentation of package abrem is now underway. The package is WeibullR (because you can’t have a dash in an R label). The primary application object has been refactored to wblr, and every effort has been made to assure functional consistency with the example scripts presented in “Using abrem”.
http://www.openreliability.org/using-abrem/
Much expansion of the package has already been implemented. Features such as:
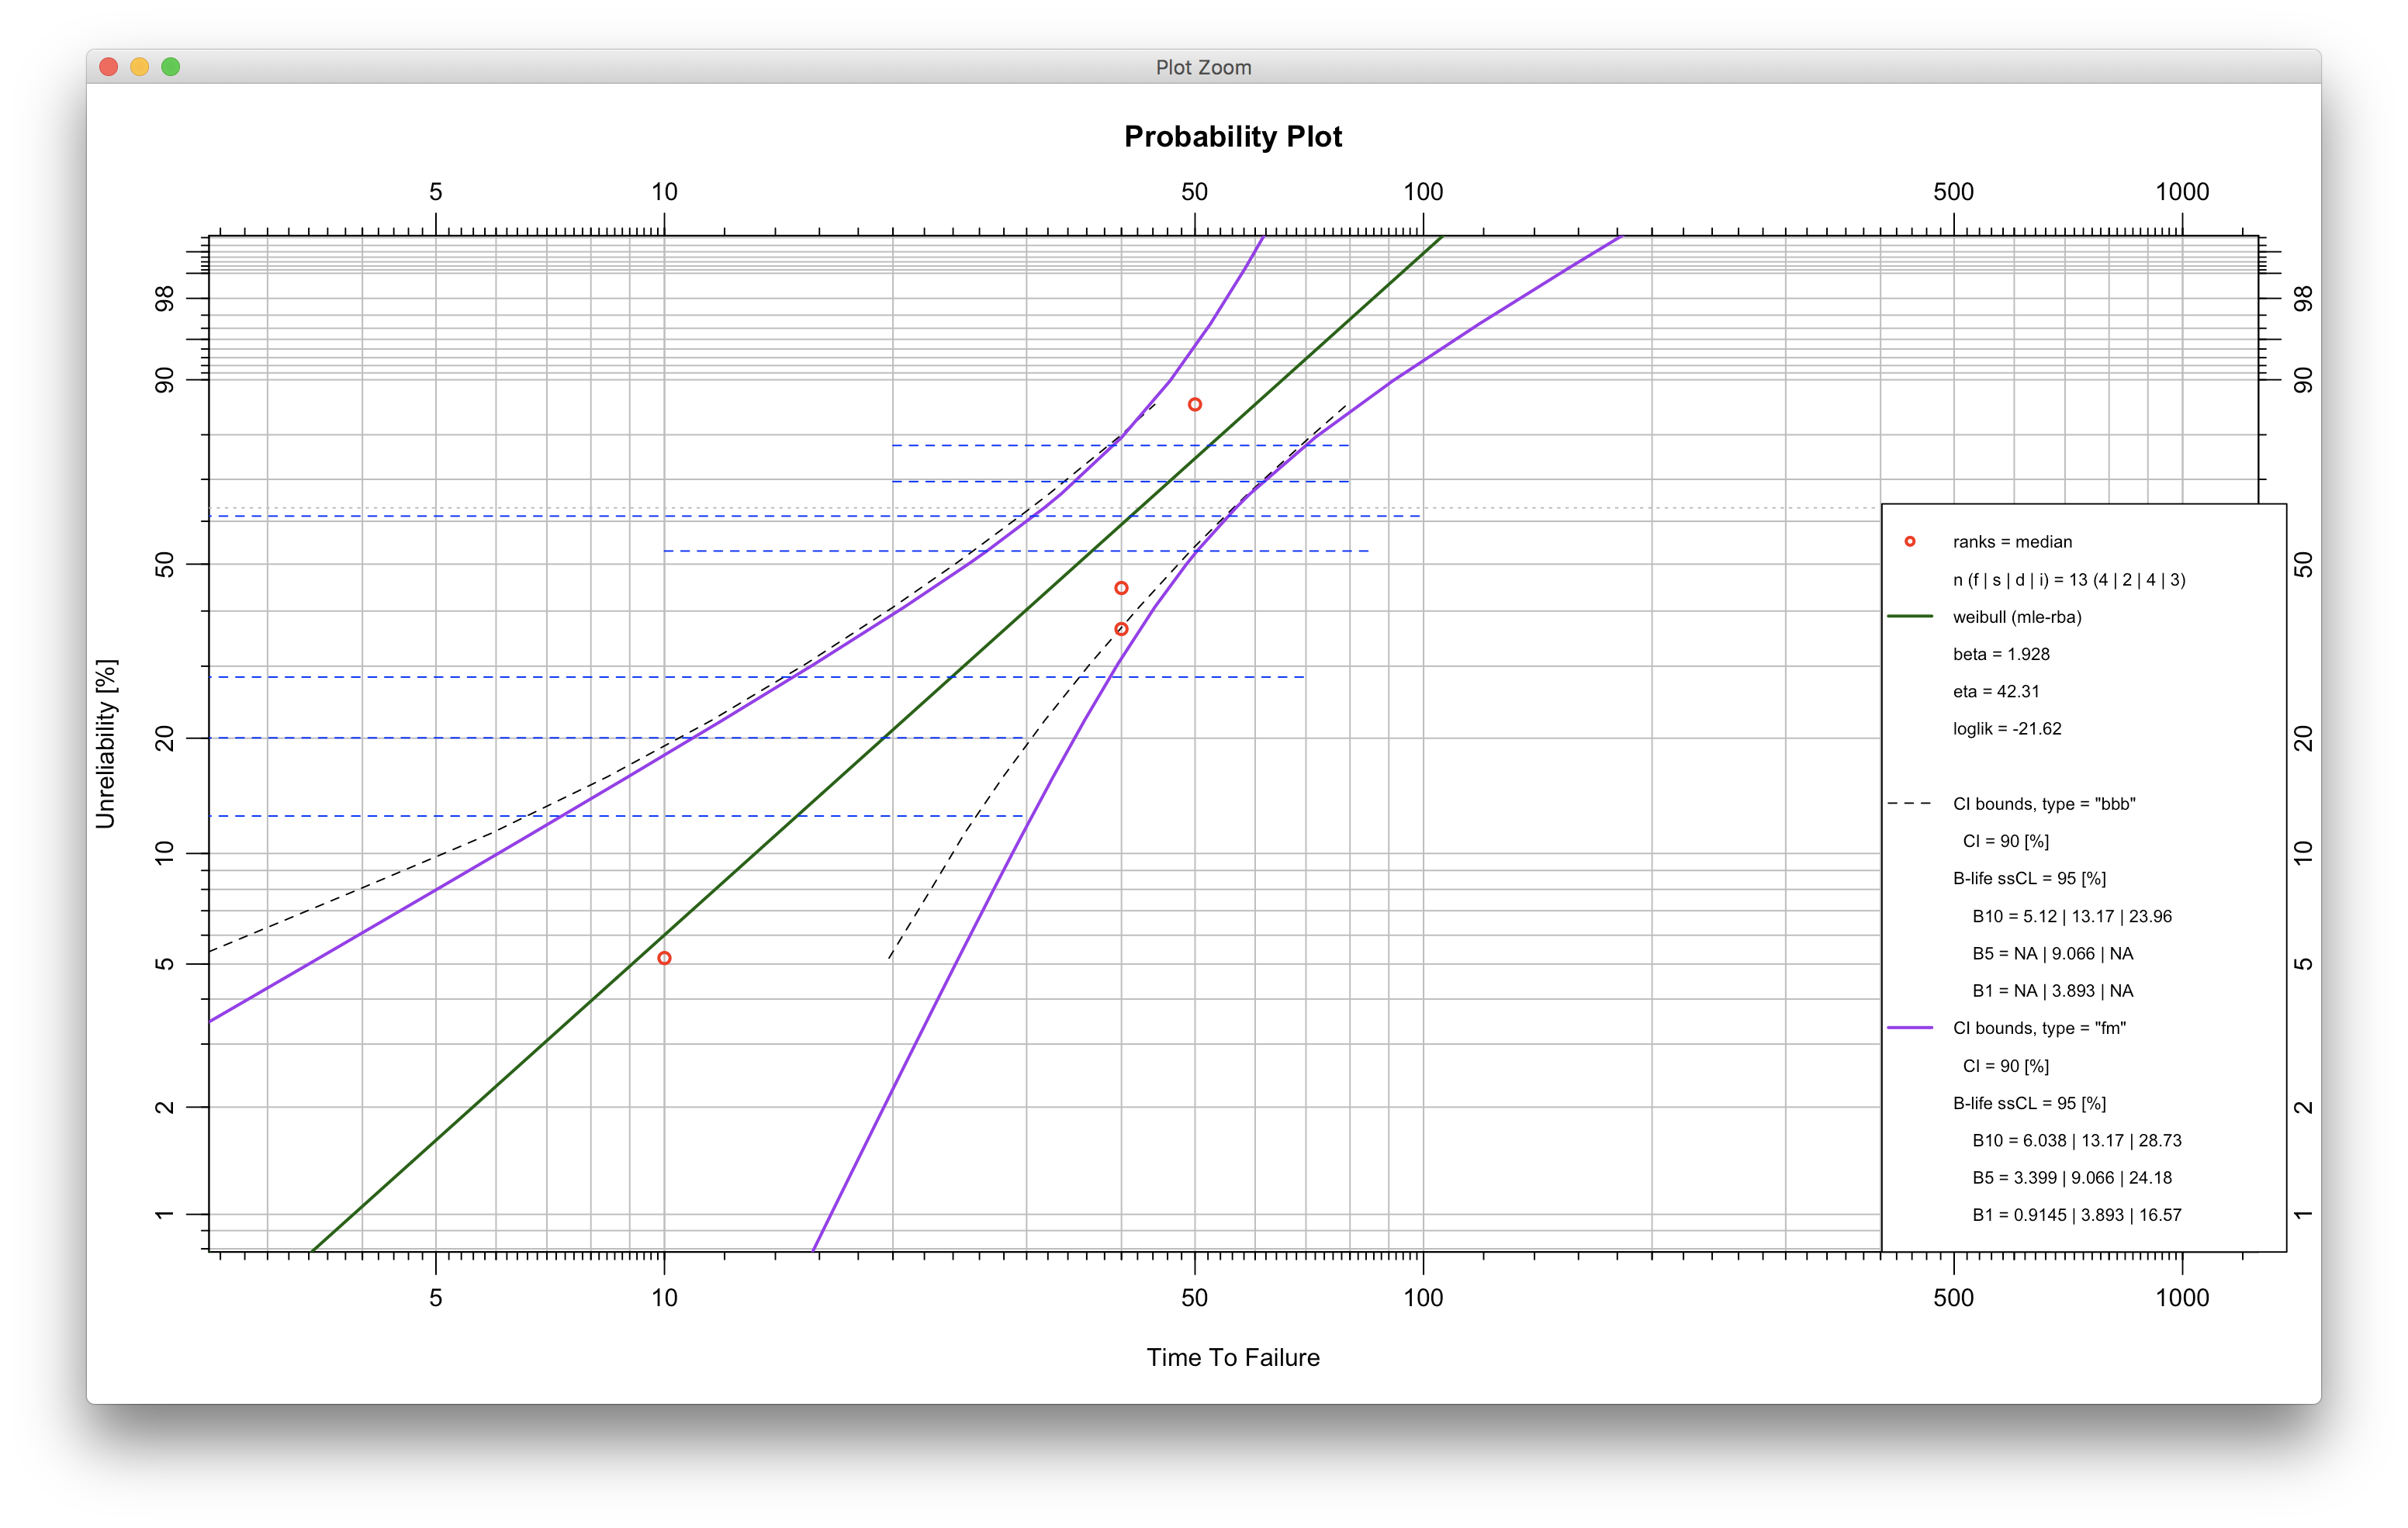
- Interval data can now be input, analyzed and displayed. Applicable options for the lognormal distribution have been fully implemented.
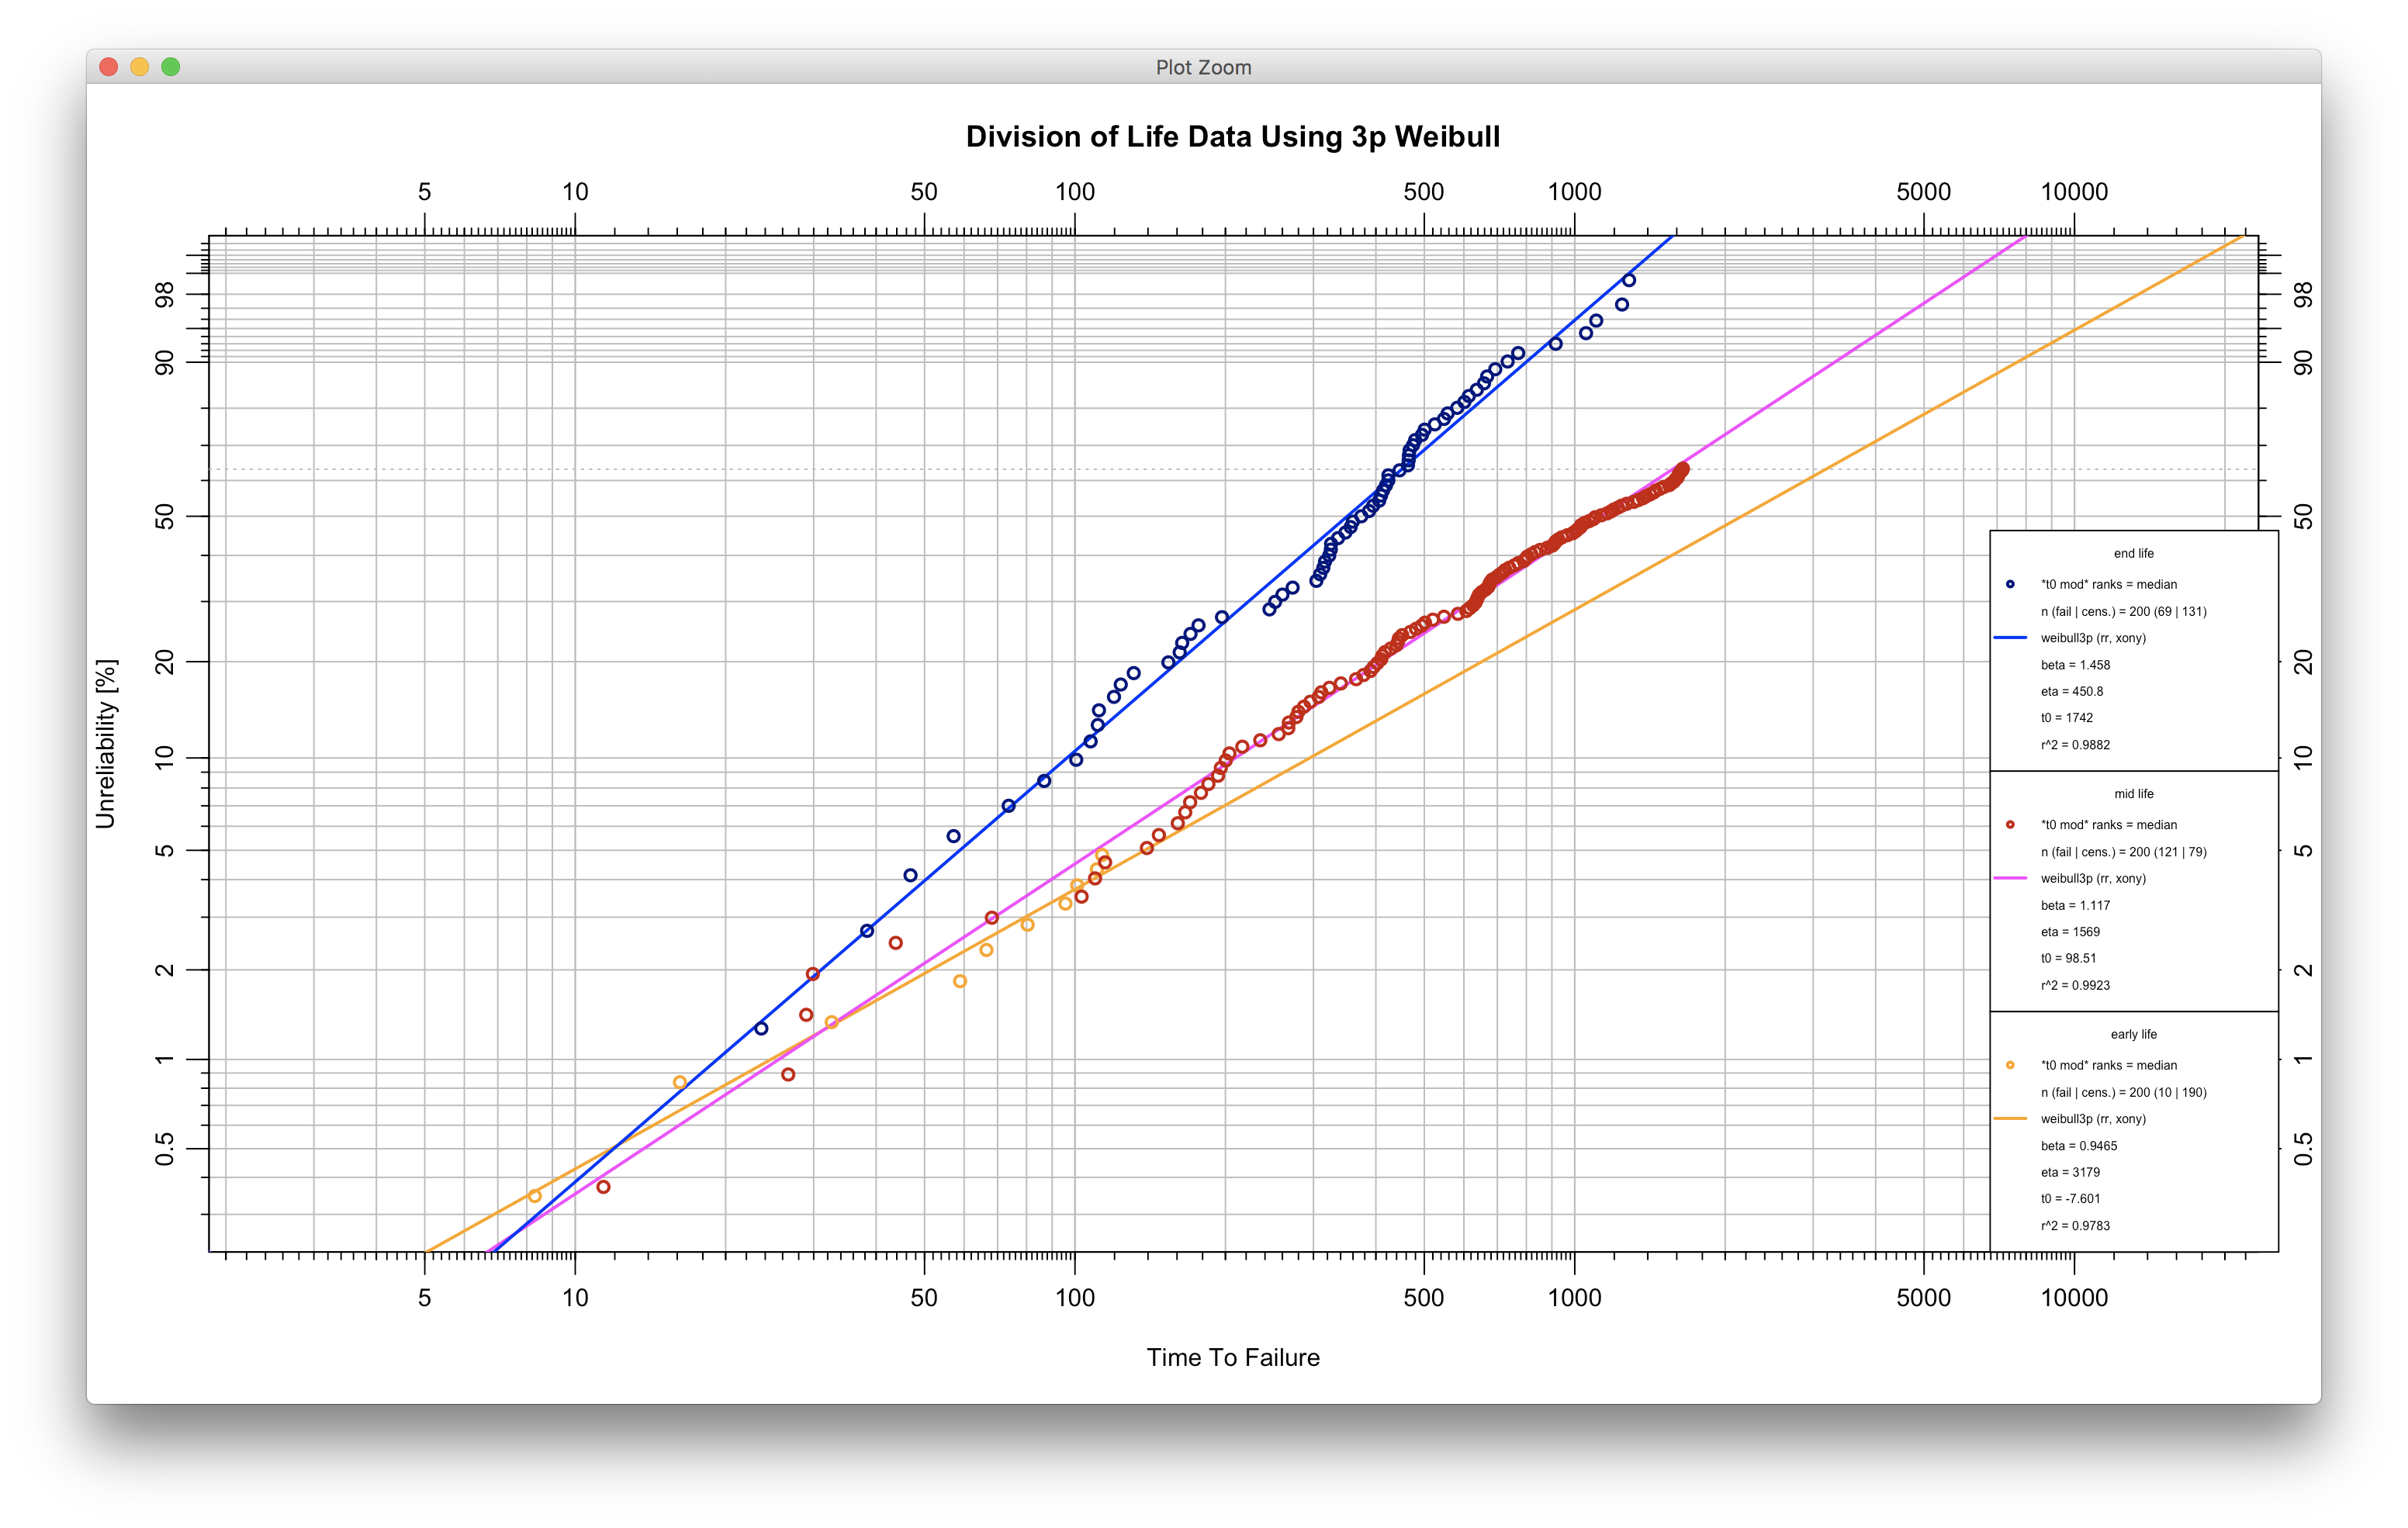
- An automated methodology for object modification by third parameter adjustment is provided.
- Fisher Matrix bound preparation is now included.
- Under the hood there has been much review to streamline code, consolidate files, refactor several option labels, revise legends and integrate all compiled C++ sources within a single package.
- A compiled package can be downloaded from R-Forge https://r-forge.r-project.org/R/?group_id=2252
Additionally, the source is available on Github:
https://github.com/Weibull-R/WeibullR
It is desired to have a community that will be kept up to date, so you are encouraged to set a “watch” on github and use the “issues” feature to communicate to the group.
- Install the package:
devtools::install_github("Weibull-R/WeibullR")- A script for using interval data and showing both bbb and fm bounds follows:
library(WeibullR)
fail <- c(10,40,40,50)
susp <- c(20,60)
left <- c(0,0,0,20,10)
right <- c(30,70,100,80,85)
qty <- c(2,1,1,2,1)
interval_ex <- data.frame(left,right,qty)
ival_test <- wblr(fail, susp, interval_ex, col="red",interval.col="blue")
ival_test <- wblr.fit(ival_test, method.fit="mle-rba", col="darkgreen")
ival_test <- wblr.conf(ival_test, method.conf="bbb",lty=2, lwd=1, col="black")
ival_test <- wblr.conf(ival_test, method.conf="fm", col="purple")
plot(ival_test)- A script for automating 3p fitting with modification by to follow:
library(WeibullR)
data('daDF')
# Alternative, read csv
# daDF <- read.table("./data/daDF.csv")
da <- as.vector(daDF[,1])
earlyda <- da[1:10]
midda <- da[11:131]
endda <- da[132:200]

earlyfit.3p <- wblr.fit(wblr(fail=earlyda, susp=c(midda,endda), col="orange", label="early life"), dist="weibull3p", modify.by.t0=T, col="orange")

midfit.3p <- wblr.fit(wblr(fail=midda, susp=c(earlyda,endda), col="red3", label="mid life"), dist="weibull3p", modify.by.t0=T, col="magenta")

endfit.3p <- wblr.fit(wblr(fail=endda, susp=c(earlyda,midda), col="navyblue", label="end life"), dist="weibull3p", modify.by.t0=T, col="blue")

plot.wblr(list(earlyfit.3p,midfit.3p,endfit.3p), legend.text.size=0.5, main="Division of Life Data Using 3p Weibull") 
