Kubernetes-Demo-Jan-2021
Hi! Welcome!
This is a repo I put together for a demo.
What does this do?
A Kubernetes cluster is spun up to use as part of a demo.
How?
A Kubernetes cluster is spun up using GCP's gcloud cli, take a look at this file in this repo:
.github/workflows/gitops.yml
That's using github actions to run the gcloud cli commands.
You'll see some if's:
if: startsWith(github.ref, 'refs/tags/release-')
Release tags with github actions
I'm leveraging github's tagging functionality to trigger the creation and deletion of the cluster.
Take a look here for the tags I've been creating:
https://github.com/CariZa/Kubernetes-Demo-Jan-2021/releases
The way I've used it is more just for demo purposes, you can leverage git in many ways - eg on commits or on branches.
Read the github actions documentation here:
Service Accounts with GCP
How about the GCP side, how am I connecting from github actions to GCP?
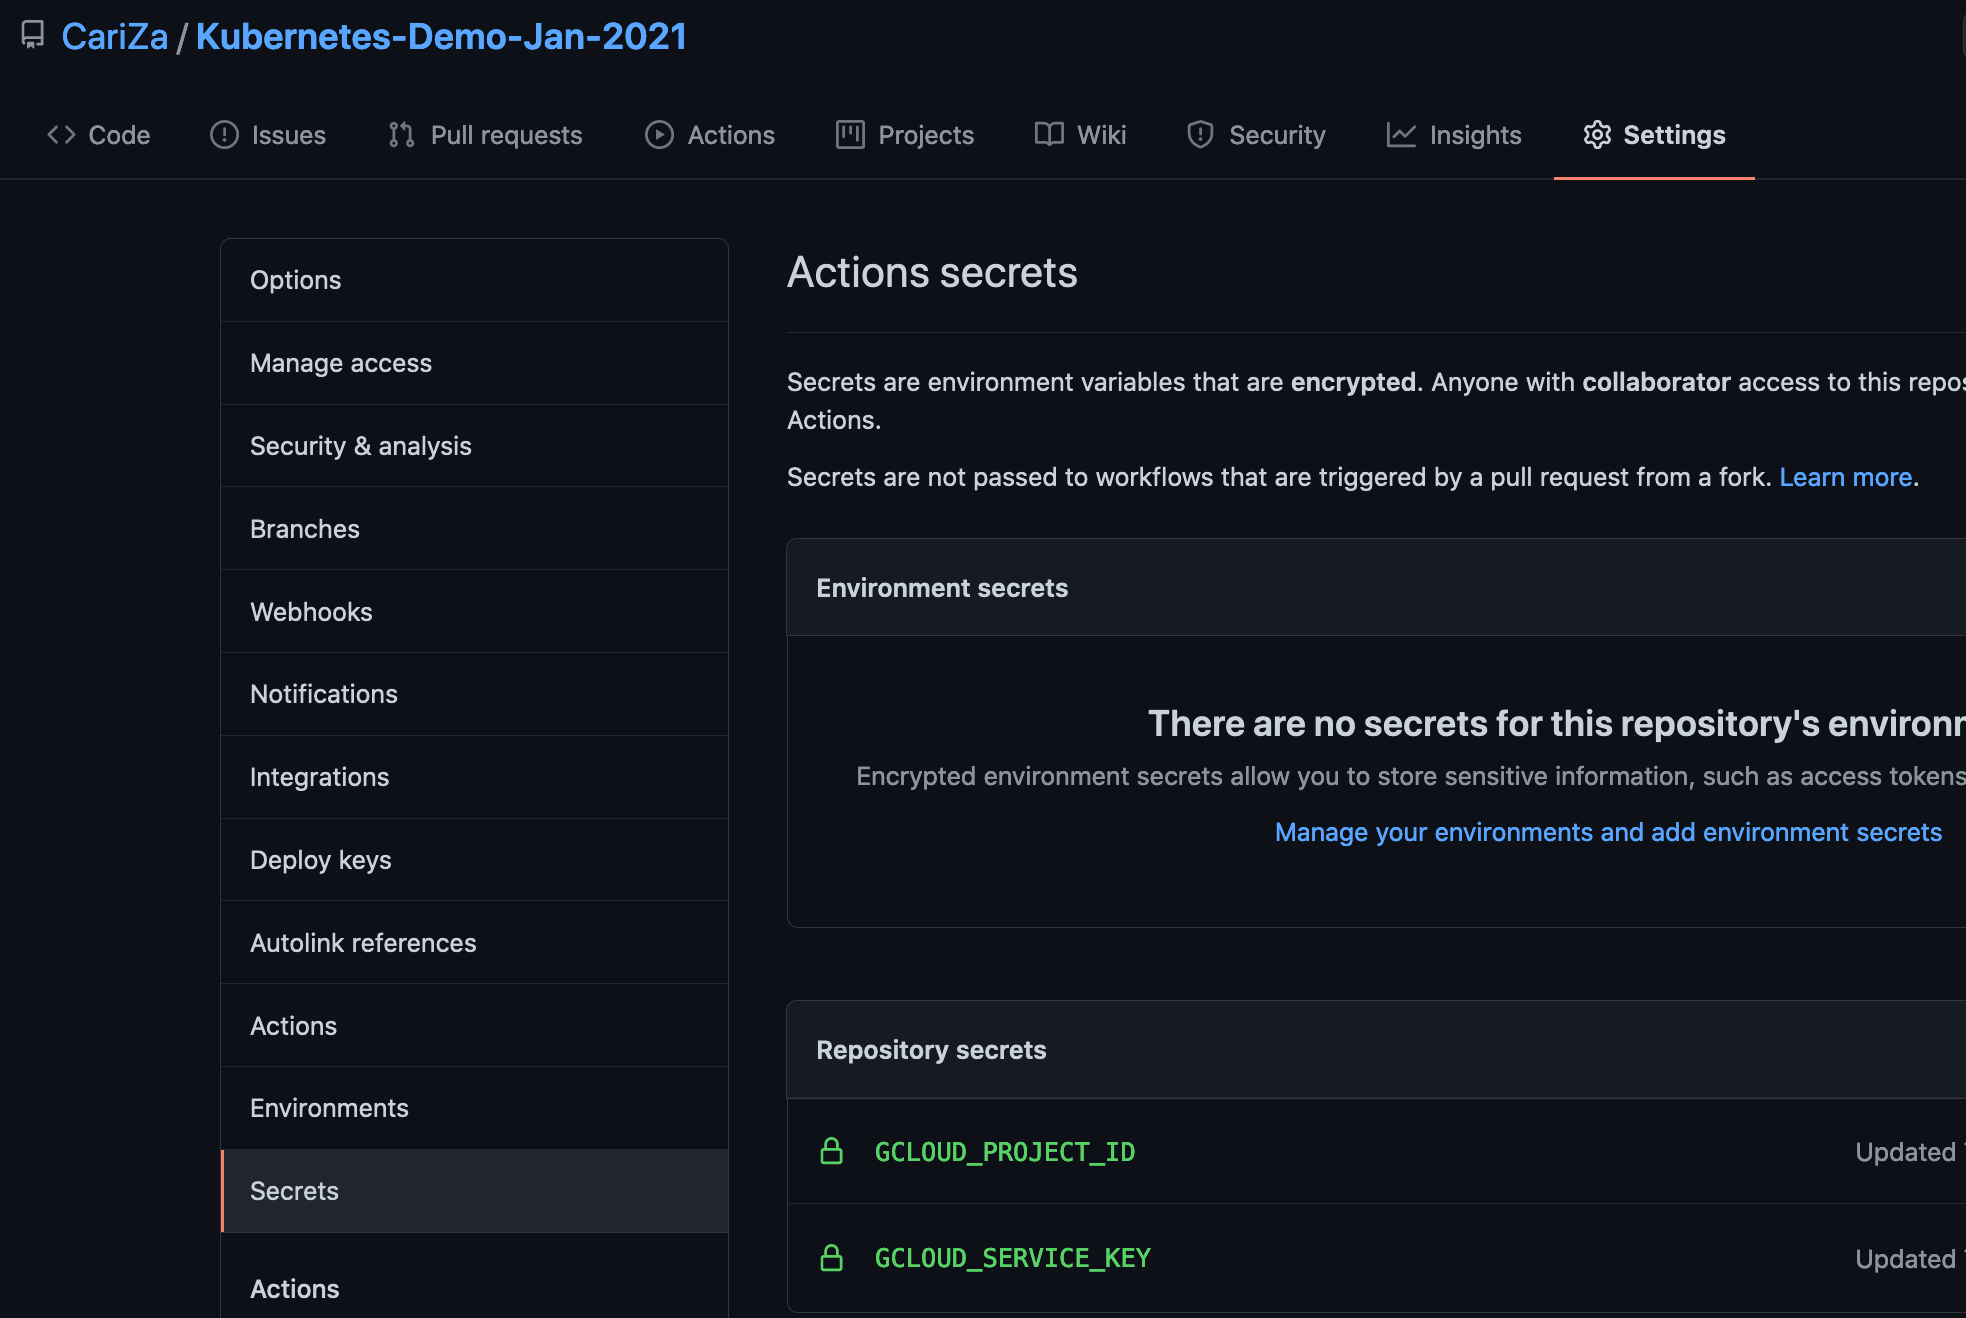
Well I created a service account, and gave the service account permissions to create clusters. Then I stored the credentials json I downloaded when I created the service account as a base64 encoded secret on github.
Read more on creating service accounts with GCP:
https://cloud.google.com/iam/docs/creating-managing-service-accounts
Take a look again in this file ".github/workflows/gitops.yml":
- name: Set up Cloud SDK
  uses: google-github-actions/setup-gcloud@master
  with:
    project_id: ${{ secrets.GCLOUD_PROJECT_ID }}
    service_account_key: ${{ secrets.GCLOUD_SERVICE_KEY }}
    export_default_credentials: true
Here's a screenshot for you of where you can add secrets on github:
Adding application to kubernetes
I've created these folders:
./kubernetes
    ./general
I'm adding in some general yaml files:
Namespace
I'd like to create a namespace for prometheus called "monitoring":
kubectl create namespace monitoring --dry-run=client -o yaml > kubernetes/general/monitoring-namespace.yml
Helm templates
Helm templates are a great way to pull down yaml files to apply to your kubernetes cluster.
https://helm.sh/docs/helm/helm_template/
Prometheus chart:
https://github.com/prometheus-community/helm-charts
Check compatibility:
https://github.com/prometheus-operator/kube-prometheus#compatibility
Check kubernetes version by running:
$ kubectl version
I'm using the prometheus templates, here are the steps I took to get the templates I'm using:
$ helm repo add stable https://charts.helm.sh/stable

$ helm repo add prometheus-community https://prometheus-community.github.io/helm-charts

$ helm repo update
You can list helm repos:
$ helm repo list
A gotcha - had to kind of do this - there's been some chages to the chart that requires additional configuraiton to get it working:
https://raw.githubusercontent.com/prometheus-operator/prometheus-operator/release-0.45/bundle.yaml
Retrieve prometheus yaml files:
$ helm template monitoring --output-dir kubernetes/helm -n monitoring prometheus-community/kube-prometheus-stack \
--set kubelet.serviceMonitor.https=true \
--set prometheus.prometheusSpec.serviceMonitorSelectorNilUsesHelmValues=false \
--set prometheusOperator.admissionWebhooks.enabled=false
Note the "--set prometheusOperator.admissionWebhooks.enabled=false" is something to help with this GKE demo - this is not a recommended approach for production ready environments
Notice the "-n monitoring"? That's going to use the namespace we want to setup.
Also - a head's up, this took me a few hours to figure out, this flag is pretty important:
--set prometheusOperator.tls.enabled=false
Some things have changed in the chart and that causes issues with a tls-secret that never gets created, more info:
prometheus-community/helm-charts#418
There is now these folders:
./kubernetes
    ./helm
        ./kube-prometheus-stack
            ./charts
                ...
            ./templates
                ...
Port Forward Grafana
View the grafana dashboard:
$ kubectl port-forward $(kubectl get pods --selector=app.kubernetes.io/name=grafana -n monitoring --output=jsonpath="{.items[0].metadata.name}") -n monitoring 3000
Get kibana credentials:
Base64 encrypted admin password
$ GRAFANA_USERNAME=$(echo $(kubectl get secret --namespace monitoring monitoring-grafana -o jsonpath="{.data.admin-user}") | base64 --decode)

$ GRAFANA_PASSWORD=$(echo $(kubectl get secret --namespace monitoring monitoring-grafana -o jsonpath="{.data.admin-password}") | base64 --decode)
$ echo
You would then use:
username: admin
password: prom-operator
View in browser:
$ kubectl port-forward $(kubectl get pods --selector=app.kubernetes.io/name=grafana -n monitoring --output=jsonpath="{.items[0].metadata.name}") -n monitoring 3000
And visit: http://localhost:3000 in your browser
Connect to GCP cluster
$ export KUBECONFIG=$HOME/.kube/kubeconfig

$ gcloud container clusters list

$ gcloud container clusters get-credentials gcp-manual-demo-cluster --region=europe-west4-a
