This repository contains code to train several self-Supervised Cardiac Phase Detection models on 4D cardiac magnetic resonance (CMR) cine images. This repository was used for the following paper: Self-supervised motion descriptor for cardiac phase detection in 4D CMR based on discrete vetor field estimation.
For a more detailed description, a model definition and further results we refer to our paper.

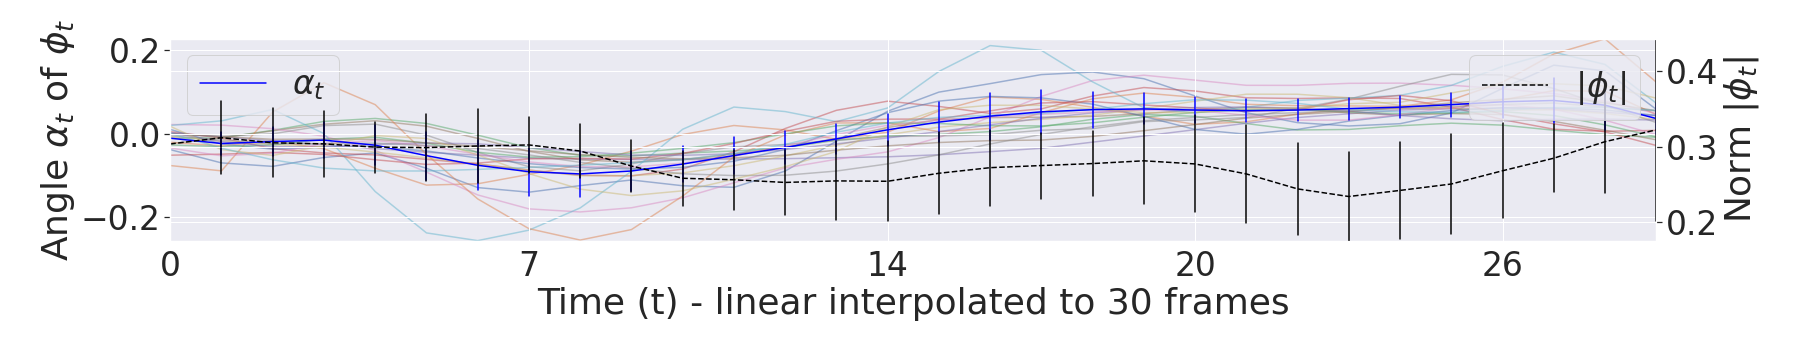
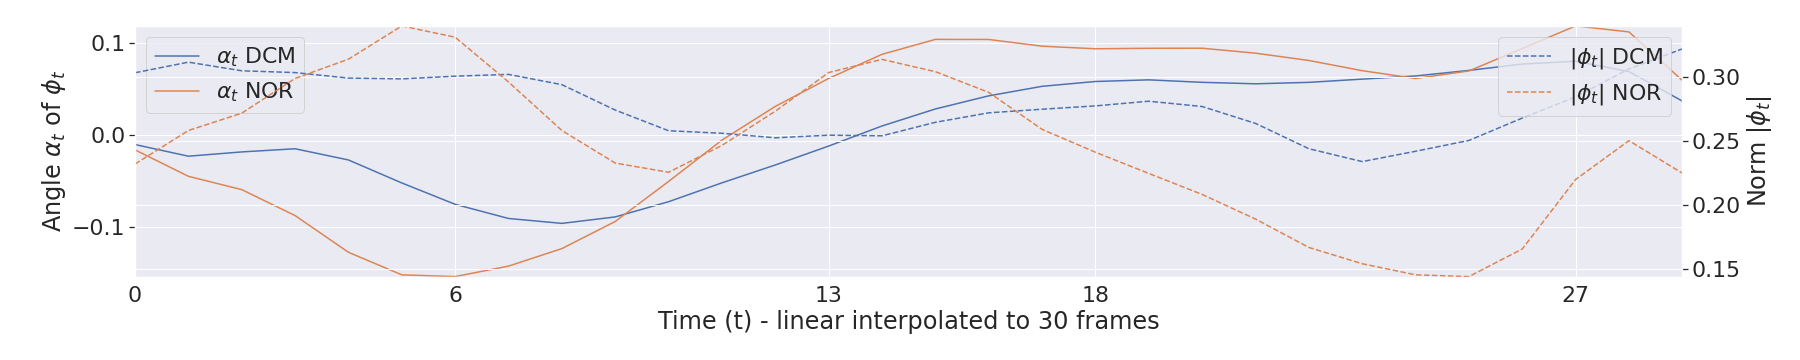
In this work, we show how to efficiently reduce a 3D+t deformable vector field into a 1D motion descriptor representing the general dynamic pattern of a cardiac cycle in a self-supervised manner. We evaluate the plausibility of this motion descriptor and apply it to the task of cardiac phase detection. Here, we define a rule-set based on the expected cardiovascular physiological properties of a contracting/relaxing ventricle and extract the ED/ES phase at the turning point of deformation. To verify the plausibility of the motion descriptor in the intermediate frames, we further extend this rule-set to extract three additional physiologically relevant time points (cf. Sec. 4 of our paper) and compare them with clinical labels from an experienced pediatric cardiologist on two heterogeneous cohorts.

This Readme covers the following topics:
- Motivation
- Cite and Paper
- Abstract
- Poster
- Code and Repo Overview
- Dataset description
- Trainings scripts
- Prediction scripts
- Evaluation scripts and dataframe description
- Setup instructions
Please cite the following paper (accepted for the STACOM Workshop @ MICCAI2022) if you use/modify or adapt parts of this repository:
Lab Arxiv Paper Complete Proceeding DOI
@InProceedings{10.1007/978-3-031-23443-9_7,
  author="Koehler, Sven
  and Hussain, Tarique
  and Hussain, Hamza
  and Young, Daniel
  and Sarikouch, Samir
  and Pickardt, Thomas
  and Greil, Gerald
  and Engelhardt, Sandy",
  editor="Camara, Oscar
  and Puyol-Ant{\'o}n, Esther
  and Qin, Chen
  and Sermesant, Maxime
  and Suinesiaputra, Avan
  and Wang, Shuo
  and Young, Alistair",
  title="Self-supervised Motion Descriptor for Cardiac Phase Detection in 4D CMR Based on Discrete Vector Field Estimations",
  booktitle="Statistical Atlases and Computational Models of the Heart. Regular and CMRxMotion Challenge Papers",
  year="2022",
  publisher="Springer Nature Switzerland",
  address="Cham",
  pages="65--78",
  abstract="Cardiac magnetic resonance (CMR) sequences visualise the cardiac function voxel-wise over time. Simultaneously, deep learning-based deformable image registration is able to estimate discrete vector fields which warp one time step of a CMR sequence to the following in a self-supervised manner. However, despite the rich source of information included in these 3D+t vector fields, a standardised interpretation is challenging and the clinical applications remain limited so far. In this work, we show how to efficiently use a deformable vector field to describe the underlying dynamic process of a cardiac cycle in form of a derived 1D motion descriptor. Additionally, based on the expected cardiovascular physiological properties of a contracting or relaxing ventricle, we define a set of rules that enables the identification of five cardiovascular phases including the end-systole (ES) and end-diastole (ED) without usage of labels. We evaluate the plausibility of the motion descriptor on two challenging multi-disease, -center, -scanner short-axis CMR datasets. First, by reporting quantitative measures such as the periodic frame difference for the extracted phases. Second, by comparing qualitatively the general pattern when we temporally resample and align the motion descriptors of all instances across both datasets. The average periodic frame difference for the ED, ES key phases of our approach is {\$}{\$}0.80{\backslash}pm {\{}0.85{\}}{\$}{\$}0.80{\textpm}0.85, {\$}{\$}0.69{\backslash}pm {\{}0.79{\}}{\$}{\$}0.69{\textpm}0.79which is slightly better than the inter-observer variability ({\$}{\$}1.07{\backslash}pm {\{}0.86{\}}{\$}{\$}1.07{\textpm}0.86, {\$}{\$}0.91{\backslash}pm {\{}1.6{\}}{\$}{\$}0.91{\textpm}1.6) and the supervised baseline method ({\$}{\$}1.18{\backslash}pm {\{}1.91{\}}{\$}{\$}1.18{\textpm}1.91, {\$}{\$}1.21{\backslash}pm {\{}1.78{\}}{\$}{\$}1.21{\textpm}1.78). Code and labels are available on our GitHub repository. https://github.com/Cardio-AI/cmr-phase-detection.",
  isbn="978-3-031-23443-9"
}
Cardiac magnetic resonance (CMR) sequences visualise the cardiac function voxel-wise over time. Simultaneously, deep learning- based deformable image registration is able to estimate discrete vector fields which warp one time step of a CMR sequence to the following in a self-supervised manner. However, despite the rich source of informa- tion included in these 3D+t vector fields, a standardised interpretation is challenging and the clinical applications remain limited so far. In this work, we show how to efficiently use a deformable vector field to describe the underlying dynamic process of a cardiac cycle in form of a derived 1D motion descriptor. Additionally, based on the expected cardiovascular physiological properties of a contracting or relaxing ventricle, we define a set of rules that enables the identification of five cardiovascular phases including the end-systole (ES) and end-diastole (ED) without usage of labels. We evaluate the plausibility of the motion descriptor on two chal- lenging multi-disease, -center, -scanner short-axis CMR datasets. First, by reporting quantitative measures such as the periodic frame difference for the extracted phases. Second, by comparing qualitatively the gen- eral pattern when we temporally resample and align the motion descrip- tors of all instances across both datasets. The average periodic frame difference for the ED, ES key phases of our approach is 0.80 ± 0.85, 0.69 ± 0.79 which is slightly better than the inter-observer variability (1.07 ± 0.86, 0.91 ± 1.6) and the supervised baseline method (1.18 ± 1.91, 1.21 ± 1.78). Code and labels will be made available on our GitHub repository.
https://github.com/Cardio-AI/cmr-phase-detection
├── LICENSE
├── Makefile           <- Makefile with commands like 'make environment' or 'make requirement'
├── README.md          <- The top-level README for developers using this project.
├── data                     <- Ideally, dont save any data within the repo, if neccessary, use these folders
│   ├── metadata       <- Excel and csv files with additional metadata
│   ├── interim        <- Intermediate data that has been transformed.
│   ├── predicted      <- Model predictions, will be used for the evaluations
│   └── raw            <- The original, immutable data dump.
│
│
├── notebooks          <- Jupyter notebooks.
│   ├── Dataset        <- call the dataset helper functions, to analyze and slice the Dataset
│   ├── Evaluate       <- See further below, reference to google-colab
│   ├── Predict        <- Generate predictions for each fold
│   ├── Train          <- Train a new model
│
├── exp            <- Experiment folders, one exp-Folder per config file, one sub-folder per CV-split
│                               Each exp-folder has the following files:
│   ├── configs        <- Experiment config files as json
│   ├── figures        <- Generated graphics and figures to be used in reporting
│   ├── history        <- Tensorboard trainings history files
│   ├── models         <- Trained and serialized models, model predictions, or model summaries
│   ├── models.png     <- Model summary as picture
│   └── tensorboard_logs  <- Generated figures/predictions, created while training to inspect the progress
│
├── requirements.txt   <- The requirements file for reproducing the analysis environment, e.g.
│                         generated with `pip freeze > requirements.txt`
│
├── setup.py           <- Makes project pip installable (pip install -e .) so src can be imported
├── src                <- Make-data, train, and eval scripts & python modules with helpers
    ├── data           <- make_data script, Generator and pre-/post-processing utils
    ├── models         <- train-, predict- eval scripts, Model defnition and Tensorflow layers
    ├── utils          <- Metrics, losses, callbacks, io-utils, logger, notebook imports
    └── visualization  <- Plots for the data, generator or evaluations
For evaluation we used two 4D cine-SSFPs CMR SAX datasets. The annotations were made by an experienced paediatric cardiologist.
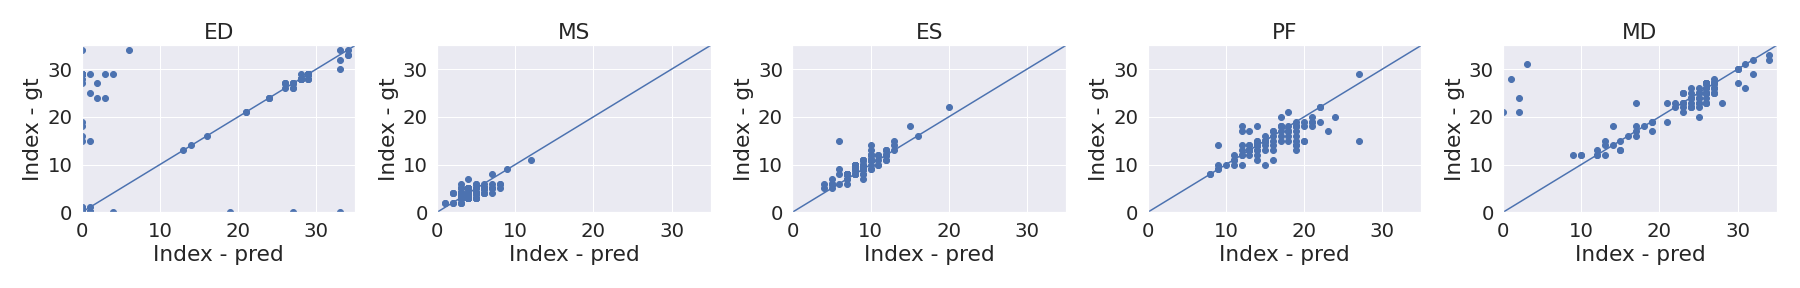
First, the publicly available Automatic Cardiac Diagnosis Challenge (ACDC) (100 patients, 5 pathologies, 2 centers) was used. The mean±SD number of frames is 26.98 ± 6.08, within a range of [12, 35]. Furthermore, not all 4D sequences capture an entire cardiac cycle. We created manual labels for five clinically relevant cardiac phases (cf. figure in overview) : including the ED, mid-systole (MS; maximum contraction resulting in a peak ejection between ED and ES), ES, peak flow (PF; peak early diastolic relaxation) and mid-diastole (MD; phase before atrial contraction at the on-set of the p-wave). Please contact us if you are interested in these labels.
Second, a multi-centric heterogeneous cine-SSFPs CMR TOF data set (278 patients) from the German Competence Network for Congenital Heart Defects) was used (study identifier: NCT00266188, title: Non-invasive Imaging and Exercise Tolerance Tests in Post-repair Tetralogy of Fallot -Intervention and Course in Patients Over 8 Years Old). The mean number of frames is 21.92 ± 4.02, within a range of [12, 36]. The sequence length of each cardiac cycle is 743±152ms, within a range of [370, 1200]. This TOF dataset constitutes one of the largest compiled data set of this pathology to date. The data was acquired at 14 different German sites between 2005-2008 on 1.5T and 3T machines; further descriptions can be found in original study, eprint previous work [1],[2]. We also labelled the five cardiac phases in this dataset. Please contact the german competence network for data access.
[1] Sarikouch S, Koerperich H, Dubowy KO, Boethig D, Boettler P, Mir TS, Peters B, Kuehne T, Beerbaum P; German Competence Network for Congenital Heart Defects Investigators. Impact of gender and age on cardiovascular function late after repair of tetralogy of Fallot: percentiles based on cardiac magnetic resonance. Circ Cardiovasc Imaging. 2011 Nov;4(6):703-11. doi: 10.1161/CIRCIMAGING.111.963637. Epub 2011 Sep 9. PMID: 21908707.
[2] Köhler, Sven, Animesh Tandon, Tarique Hussain, H. Latus, T. Pickardt, S. Sarikouch, P. Beerbaum, G. Greil, S. Engelhardt and Ivo Wolf. “How well do U-Net-based segmentation trained on adult cardiac magnetic resonance imaging data generalise to rare congenital heart diseases for surgical planning?” Medical Imaging: Image-Guided Procedures (2020).
Our trainings script support single and multi-GPU training (data-parallelisms) and should run locally, and on clusters. The trainings-flow is as follows:
-
Re-use or modify one of the example configs provided in data/cfgs
-
Run src/models/train_regression_model.py, which parse the following arguments:
-cfg (Path (str) to an experiment config, you can find examples in exp/template_cfgs) -data (Path (str) to the data-root folder with 4D nrrd files) -inmemory (bool) in memory preprocessing for cluster-based trainings -
Our trainings script will sequentially train four models on the corresponding dataset splits. The experiment config, model-definition/-weights, trainings-progress and tensorboard logs etc. will be saved automatically. After each model convergence we call the prediction scripts on the corresponding fold and save the predicted files into the sub-folders f0-f3.
-
Each experiment results in the following base-structure (note: repeating the same experiment config will create new time-step-based sub-folders):
├── alpha_per_patient.png
├── alpha_per_patient.svg
├── alpha_per_target.png
├── alpha_per_target.svg
├── cfd.csv
├── f0
├── f1
├── f2
├── f3
├── gt_phases.csv
├── moved
├── pFD_scatter.png
├── pFD_scatter.svg
├── pFD_violin.png
├── pred
├── pred_phases.csv
└── results.xlsx
- Each fold (_f0...,_f3) contains the following model specific files:
├── config (config used in this experiment fold)
├── Log_errors.log (logging.error logfile)
├── Log.log (console and trainings progress logs - if activated)
├── model (model graph and weights for later usage)
├── model.png (graph as model png)
├── model_summary.txt (layer input/output shapes as structured txt file)
└── tensorboard_logs (tensorboard logfiles: train-/test scalars and model predictions per epoch)
Usually the inference/evaluation scripts will be called automatically per fold if we start the train_regression_model.py file. Nevertheless, you can also call our predict script on other data or modify the experiment parameters.
This script takes two arguments:
        -exp (Path (str) to the root of one experiment fold)

        -data (Path (str) to the data-root folder, please check src/Dataset/make_data.py or notebooks/Dataset/prepare_data.ipynb for further hints)
Inference will load the experiment config, re-create the same model as used for training, load the final model weights and use the same pre-processing steps (Re-Sampling, cropping, scaling) as defined in the experiment config (config/config.json).
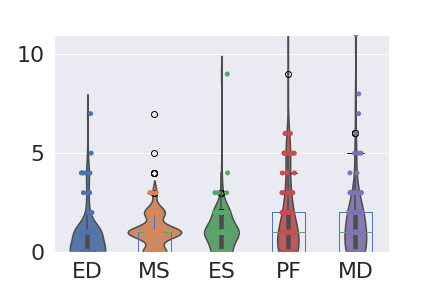
We extend the previously used average Frame Difference (aFD = |pi − pˆi |) to account for the periodicity of the cardiac cycle, and refer to it as
pFD(pi , pˆi ) = min(|pi − pˆi |, T − max(pi , pˆi ) + min(pi , pˆi ))
with i ∈ [ED, M S, ES, P F, M D] and pi , pˆi the ith ground truth and predicted label. This is important for permuted sequences when the annotated phase pi is labelled at t = 1 but, pˆi predicts t = T and vice versa. The pF D would be 1; in the original aFD formulation, the distance would be T .
The predictions of each split are collected as numpy files into the pred and moved folders. "pred" contains one numpy file per split with the cardiac phases GT info and the corresponding predicted phases.
The shape is:
patients(size of patients in this split),gt and pred(2),time(temporal input shape, defined in our config),phases(5 cardiac phases)
"moved" contains the sequential discrete vector field and the moved 4D CMR when we apply the deformable on the corresponding original 4D CMR. Ideally moved should look like the original 4D CMR but temporally shifted by one frame.
Within each experiment folder the scripts will automatically save:
-
plots (png and scg) of the 1D curves per patient alpha_per_patient and per pathology alpha_per_pathology.
-
violin and scatter plots of the cyclic frame difference (CFD) across all folds.
-
a table wih the CFD per patient (cfd.csv) and the predicted phases (pred_phases.csv and results.xlsx)


You can use the prediction notebook for further plotting and experiment comparison.
Tested with Ubuntu 20.04
- Python 3.6 locally installed (e.g.: Anaconda)
- Installed nvidia drivers, cuda and cudnn (e.g.: Tensorflow)
Clone repository
git clone %repo-name%
cd %repo-name%
Create a conda environment from environment.yaml (environment name will be septum_detection)
conda env create --file environment.yaml
Activate environment
conda activate phase_detection
Install a helper to automatically change the working directory to the project root directory
pip install --extra-index-url https://test.pypi.org/simple/ ProjectRoot
Create a jupyter kernel from the activated environment, this kernel will be visible in the jupyter lab
python -m ipykernel install --user --name pdet --display-name "phase_det kernel"
Enable interactive widgets in Jupyterlab
Pre-condition: nodejs installed globally or into the conda environment. e.g.:
conda install -c conda-forge nodejs
Install the jupyterlab-manager which enables the use of interactive widgets
jupyter labextension install @jupyter-widgets/jupyterlab-manager
Further infos on how to enable the jupyterlab-extensions: