A U-Net for 1h cumulative precipitation nowcasting over northern Germany using data from the German Weather Service (DWD)
This project is inspired by the Google-Research paper "Machine Learning for Precipitation Nowcasting from Radar Images" and the relative blog post "Using Machine Learning to "Nowcast" Precipitation in High Resolution"
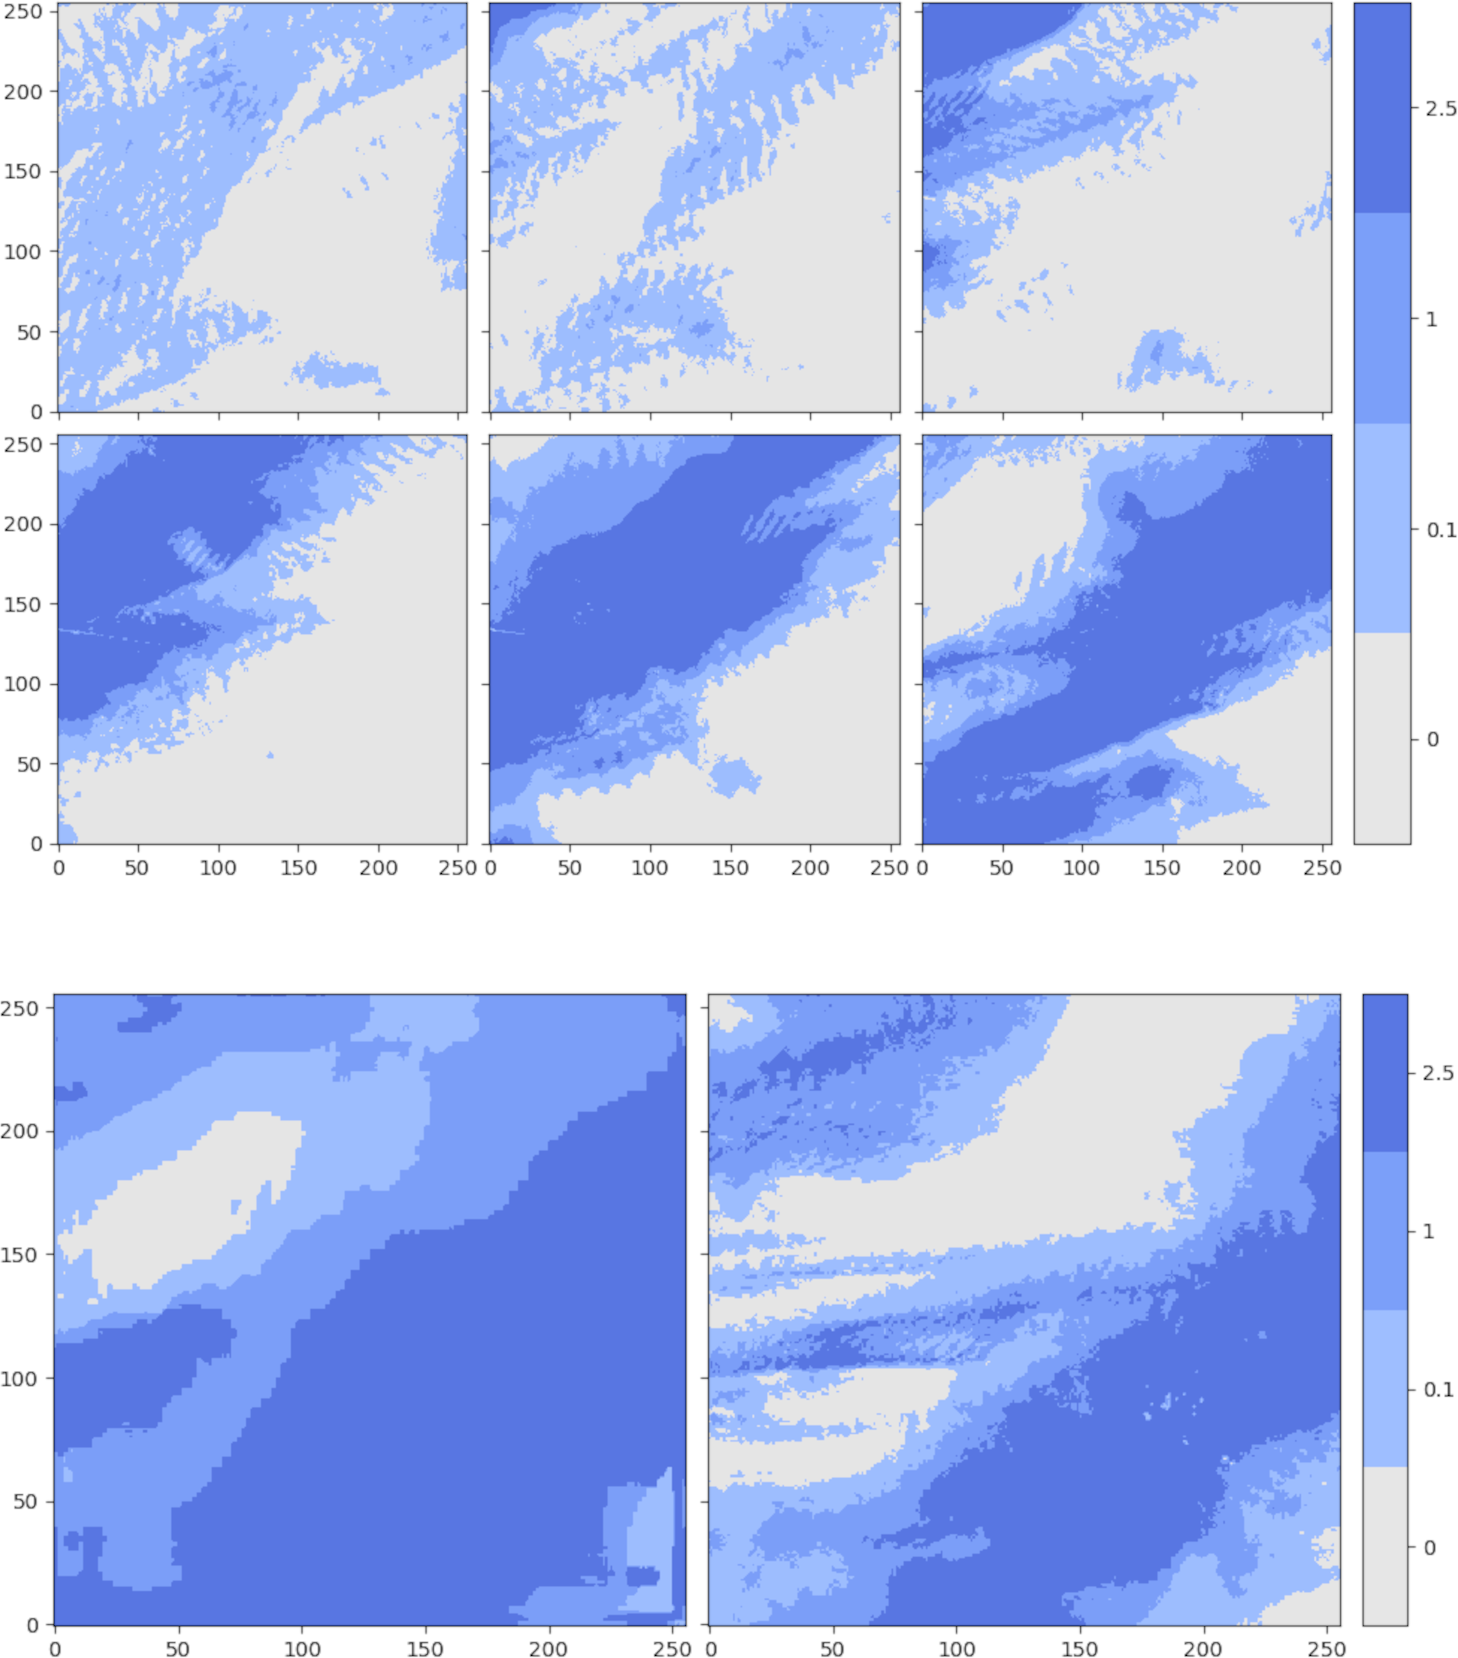
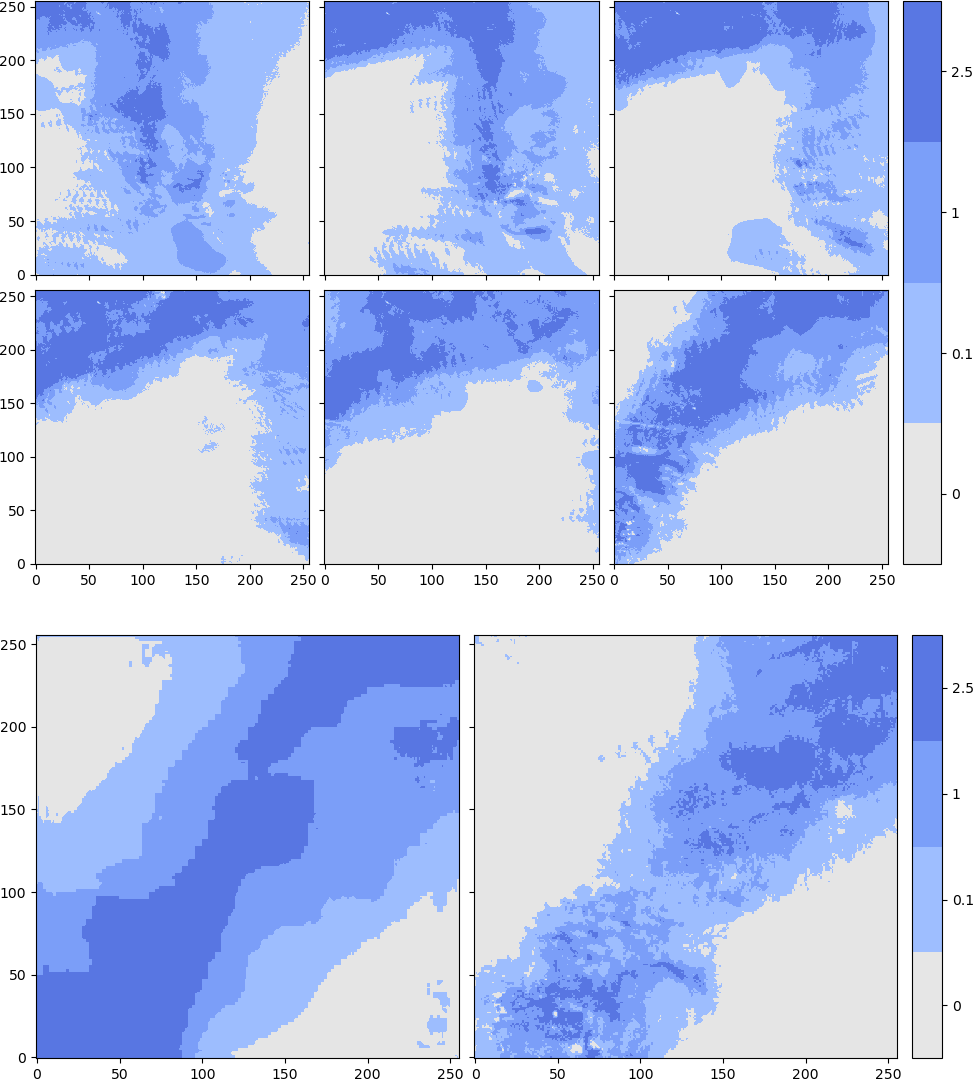 6 inputs (1h spacing, 1h cumulative) 1 output, ground truth in the lower right corner in each image. Prediction in the lower left corner. 4 classes, mm/h.
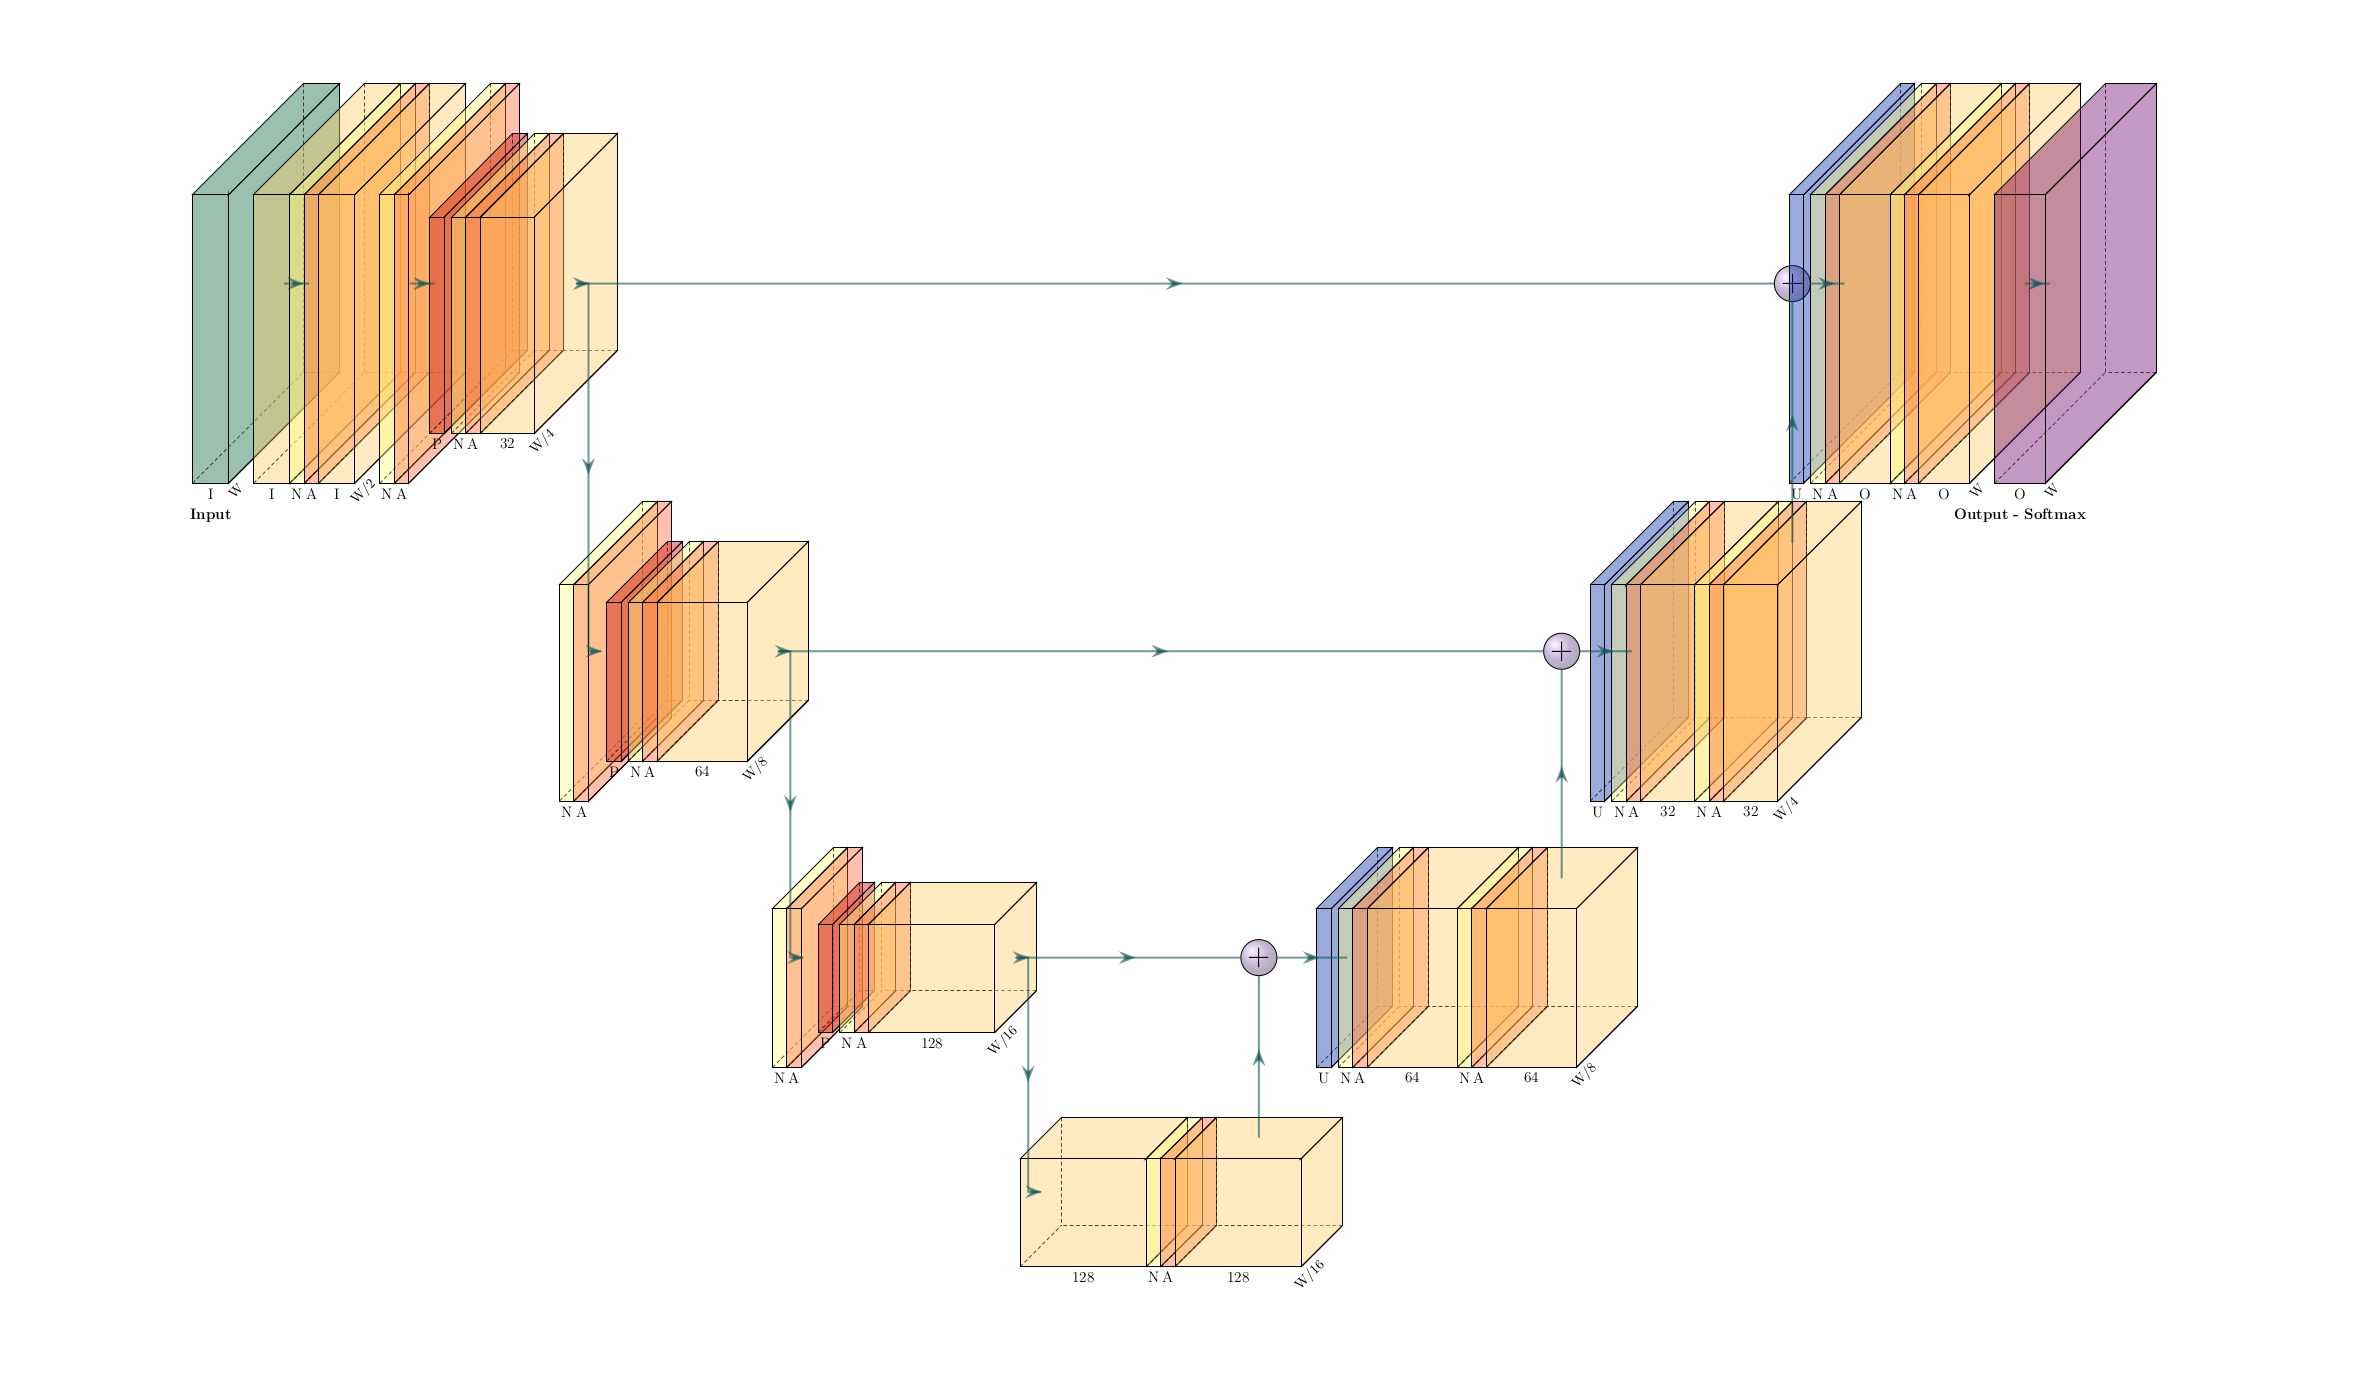
This is a U-Net for quasi-image prediction. The architecture, based on the paper mentioned above, incorporates long-range and short-range skip connections, convolutions and batch-normalization.
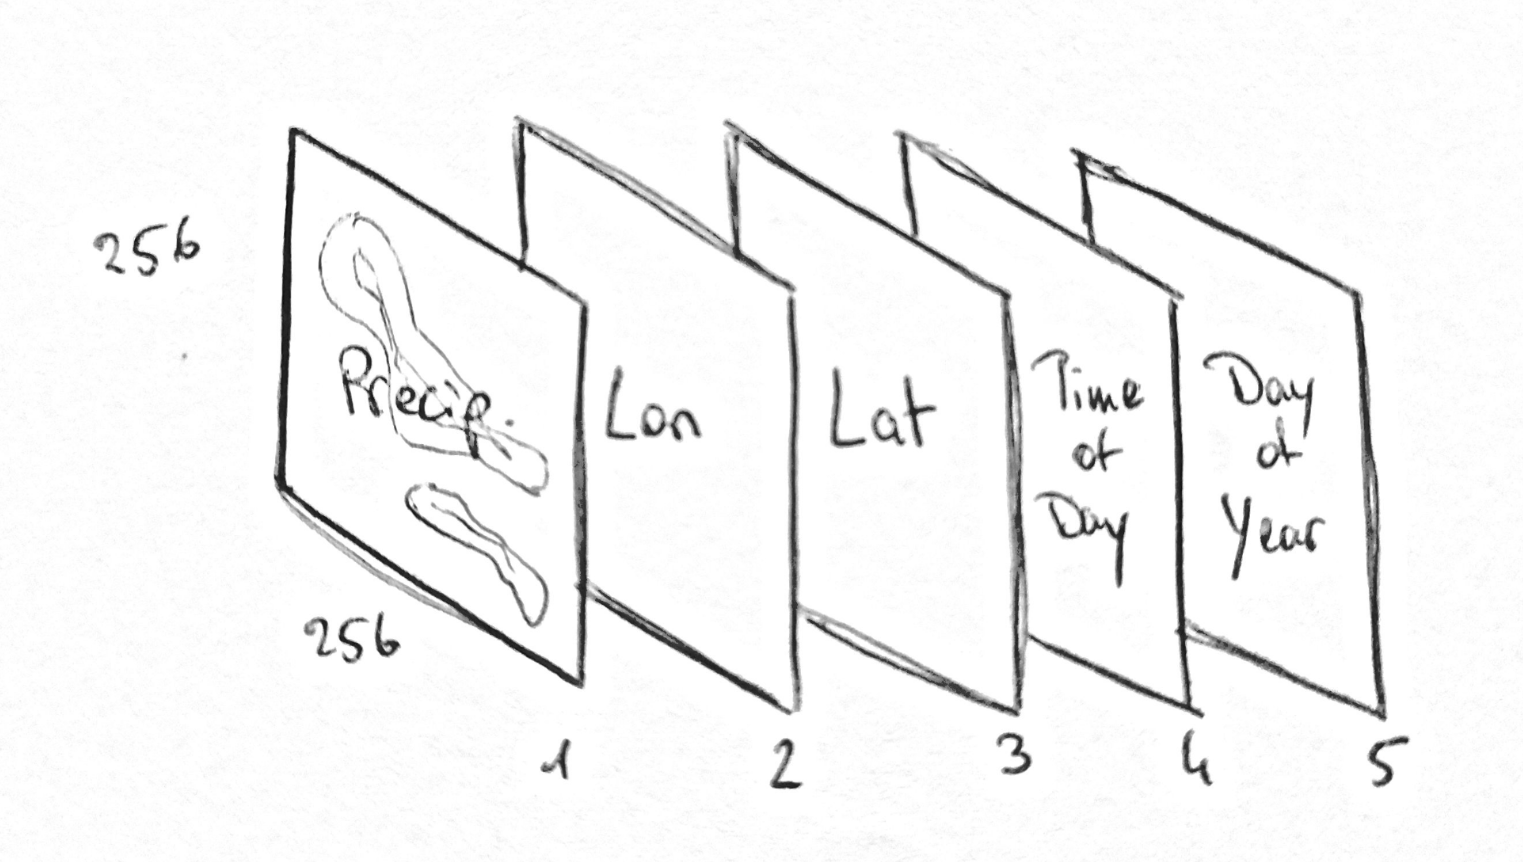
One input frame is made of 5 concatenated channels:
- precipitation (1h cumulative data)
- longitude
- latitude
- normalized time-of-day
- normalized day-of-year
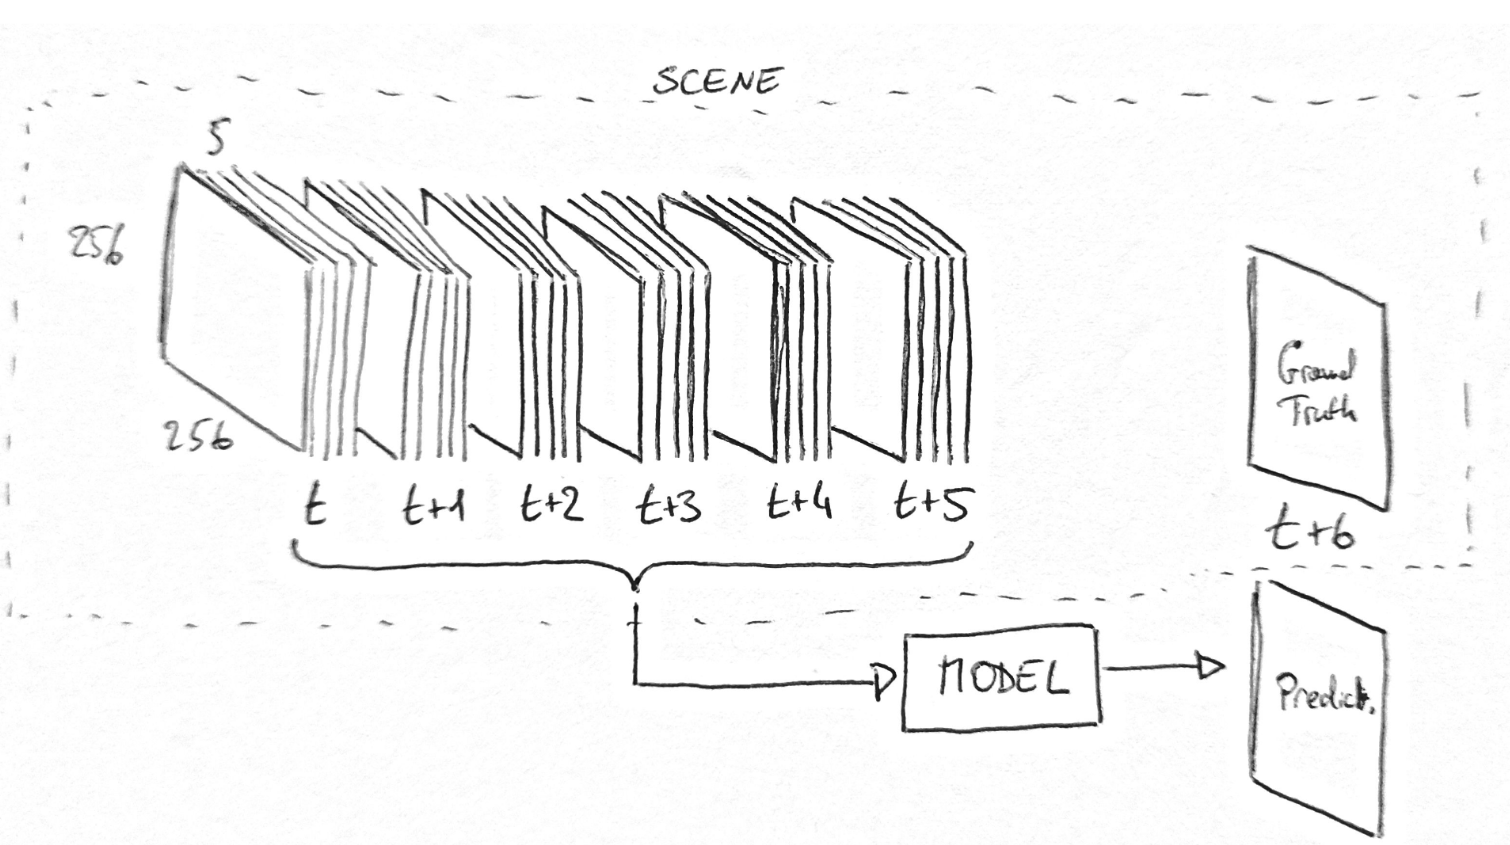
6 frames are taken as input for times t-5h, t-4h, t-3h, t-2h, t-1h and t. The output frame is made up only of the precipitation channel which is binned and not continuous as the input.
The bins of the output at t+1h are (in mm/h):
- [0, 0.1)
- [0.1, 1)
- [1, 2.5)
- [2.5,
$\infty$ )
The collection is made of
- 6 input frames
- 1 ground truth is called a scene and the timestamp for the entire scene is t-5h.)
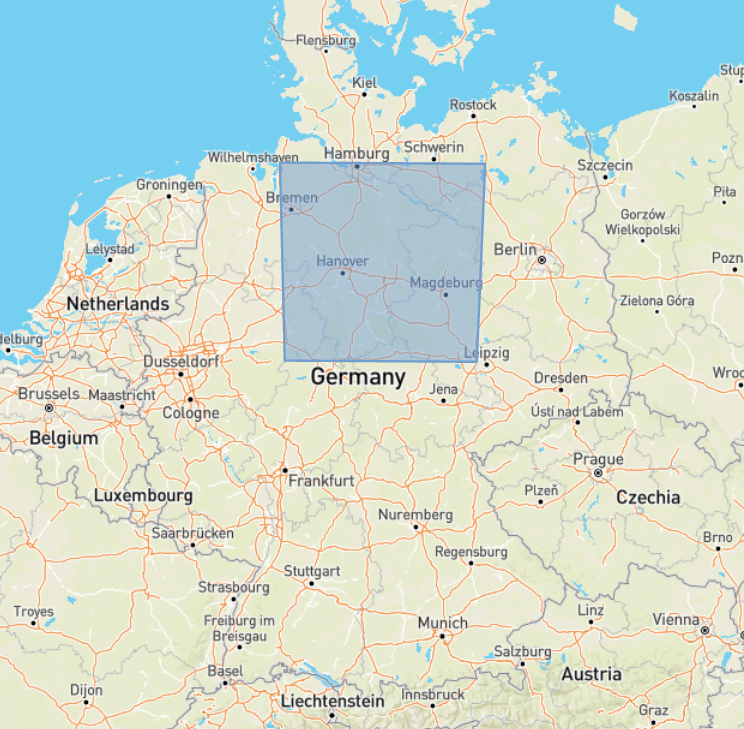
The area of interest is a square of 256km x 256km over northern Germany covering Bremen, Hamburg, Hanover and Magdeburg. The orography is considerably flat.
The data is provided for free by the German Weather Service as produced by the Radar Online Calibration (RADOLAN) routine. The opendata server is accessible at https://opendata.dwd.de/ and the precipitation products (RW) are available at https://opendata.dwd.de/climate_environment/CDC/grids_germany/hourly/radolan/historical/bin/ and https://opendata.dwd.de/climate_environment/CDC/grids_germany/hourly/radolan/recent/bin/
To install this package first clone it in a local repository with git
git clone https://github.com/Campostrini/dwd_dl.git
Create a conda environment and install the requirements. This could fail due to the pytorch installation being heavily dependent on your machine
conda env create -n meteo -f requirements.yml
and activate the environment:
conda activate meteo
Alternatively, you can use docker by building an image using the Dockerfile.
To use a CUDA device with docker follow this guide or this guide
go with
distribution=$(. /etc/os-release;echo $ID$VERSION_ID) \
      && curl -fsSL https://nvidia.github.io/libnvidia-container/gpgkey | sudo gpg --dearmor -o /usr/share/keyrings/nvidia-container-toolkit-keyring.gpg \
      && curl -s -L https://nvidia.github.io/libnvidia-container/$distribution/libnvidia-container.list | \
            sed 's#deb https://#deb [signed-by=/usr/share/keyrings/nvidia-container-toolkit-keyring.gpg] https://#g' | \
            sudo tee /etc/apt/sources.list.d/nvidia-container-toolkit.list
and
sudo apt-get update
sudo apt-get install -y nvidia-docker2
sudo systemctl restart docker
Test the installation with
docker run --rm --gpus all nvidia/cuda:11.0.3-base-ubuntu20.04 nvidia-smi
Let's build the docker image for the project
docker build -t meteo_image .
Check that the image is available
docker images
Run the image
docker run -v $HOME/dwd_dl/:/home/dwd_dl/ --gpus all -t -d meteo_image
Check that the container with the image is running with
docker ps
And use the container name to open a terminal in it
docker exec -it <container_name> /bin/bash
Look at the nvidia-smi output to see if everything is running correctly
nvidia-smi
If you're not running it inside docker, add the project directory to PYTHONPATH.
It is assumed one is using docker.
When you first run the training routine, a new hidden directory will be created with a RADOLAN_FCFG.yml file. It contains various configuration settings.
python /home/dwd_dl/dwd_dl/lightning-train.py
CTRL+C to stop.
Navigate to ~/.radolan_config and edit the RADOLAN_CFG.yml
The script also produces 5 files of the kind *_RANGES.yml. These contain the date ranges for the training, validation and test set. Modify them as you please. Beware that all the ranges should not fall outside the ranges in DATE_RANGES.yml. The ranges should be a list of lists in .yml format. Overlapping ranges will throw Exceptions.
- - YYYY-MM-DD hh:mm:ss
  - YYYY-MM-DD hh:mm:ss
Extrema are included and you should only use timestamps with mm:ss set to 50:00 as that is what the RADOLAN routine outputs.
VIDEO_RANGES.yml contains the ranges used for a video of prediction output vs. ground truth if it's requested by the user.
For the various options run
python /home/dwd_dl/dwd_dl/lightning-train.py --help
Logs are automatically saved in ~/Radolan/tt_logs/. To visualize them publish the 6006 port to the host with the -p flag when invoking docker run.
docker run -v $HOME/dwd_dl/:/home/dwd_dl/ --gpus all -p 6006:6006 -t -d meteo_image
So that, after opening a terminal in the docker container where the logs are stored, you can run
tensorboard --logdir=/path/to/tt_logs/
and access the tensorboard dashboard on your browser at localhost:6006.
If you're accessing tensorboard running on docker on a remote machine use --host 0.0.0.0.
The model weights described in the thesis were obtained by training only in winter (October-April). Training, Validation and Testing were divided as follows:
| Training | Validation | Testing | |
|---|---|---|---|
| Start | 1.10.05 | 1.1.18 | 1.1.20 |
| End | 31.12.17 | 31.12.19 | 31.12.21 |
Make sure you a directory was created at ~/.radolan_config/.
To adopt the same training, validation and testing ranges use the script dwd_dl/resources/adopt_complete_winter.sh in the project's repository.
To use the weights you have to clone the weights repo from github and download them with git lfs.
git clone https://github.com/Campostrini/dwd_dl_weights.git
Install git lfs following this guide and the run
git lfs pull
to download the weights.
Now you can run the container, remember to bind the volume with the weights
docker run -v $HOME/dwd_dl/:/home/dwd_dl/ -v $HOME/dwd_dl_weights/:/home/weights/ --gpus all -p 7777:7777 -t -d meteo_image
access it
docker exec -it <container_name> /bin/bash
and run the visualizer
python /home/dwd_dl/dwd_dl/visualize.py --model_path /home/weights/2205101547-epoch\=09-valid_loss\=0.00.ckpt --address 0.0.0.0
The model can architecturally be drastically improved. Much of the architecture was taken from "Machine Learning for Precipitation Nowcasting from Radar Images" and the relative blog post "Using Machine Learning to "Nowcast" Precipitation in High Resolution". Some choices they made don't seem canonical and the code is not openly available. Further, GANs and RRNs seem to have had more success recently compared to UNet when it comes to weather prediction.
In the training process a bottleneck is probably present in retrieving files from disk even with dask.
16-bit precision will make training drastically faster. Although cross entropy with weights seems to have some issues with the types of the weights. I found this to be machine-dependent though.
Assessing the performance with other time-frames and other variables is just a matter of adding them, this will probably have a positive result on the final precipitation prediction.
Weights seem to steer the model to over-prediction of higher precipitation classes.
- Simplify installation procedure
- Add Extensive Tests
- Add Further documentation
- General refactoring
- Solve probable bottleneck
- Solve concurrency issues with dask and multiple pytorch workers
- Create simple Flask server for deployment
