WebGL Profiling Lab
CIS 565: GPU Programming and Architecture
University of Pennsylvania
In this lab, we will use the following profiling and debugging tools to analyze the performance of open-source WebGL engines:
- Chrome DevTools CPU Profiler - JavaScript CPU performance
- Firefox Canvas Debugger or WebGL Inspector - WebGL calls and resources
- Firefox Shader Editor or Chrome Shader Editor Extension - shader editing
- Web Tracing Framework - timeline of WebGL calls per frame
- Chrome Task Manager - memory usage
- Engine-specific tools like the Cesium Inspector and BabylonJS Debug layer.
Each team will analyze any two of the WebGL engines below.
Consider the following potential bottlenecks:
- Garbage collector (browser CPU overhead)
- Shader compile and link (driver CPU overhead):
compileShader,linkProgram,getProgramParameter, and friends. See Asynchronous Shader Compilation by Brandon Jones. When is the performance hit? See Lessons learned from Bullying Shader Compilers by drawElements. - Texture/buffer upload (browser/driver CPU overhead and system memory bandwidth):
texImage2D,texSubImage2D,bufferData,bufferSubData, and friends readPixels(stall CPU and starve GPU)getParameterand otherget*functions (stall CPU for inter-process communication)- How good is the app's view frustum culling, i.e., are a lot of
drawElements/drawArrayscalls for objects that are not visible? How good is the app's batching, i.e., are there a lot of draw calls for objects with the same material?
Each team will give a short presentation on their analysis:
For each engine you analyzed:
- Quick demo of the engine.
- Discussion of major bottleneck(s) and how they could be optimized. Micro-optimizations may be appropriate, but also think higher level such as culling, state sorting, LOD, moving computation to the GPU or a web worker, etc.
- Include screenshots or demos of profiler output, timeline graphs, shaders, etc.
- Are the bottlenecks CPU or GPU bound? If GPU bound, what stage of the pipeline?
- Did the performance or bottlenecks change
- If the window was resized?
- If the shaders were simplified in the Shader Editor? What if just the texture reads are removed?
- When the camera was moving, e.g., if the app streams WebGL resources, slow-to-render objects become visible, culling becomes less effective, etc?
- Between frames, e.g., because some frames include shader compile/link, buffer uploads, etc?
- Between different browsers, e.g., because the app is CPU-bound and the JavaScript engine performance is different?
- Optional: With ANGLE enabled/disabled (Windows only). See How to Enable Native OpenGL in your Browser by JeGX.
- Optional: When software rendering is used? (see below).
WebGL Engines
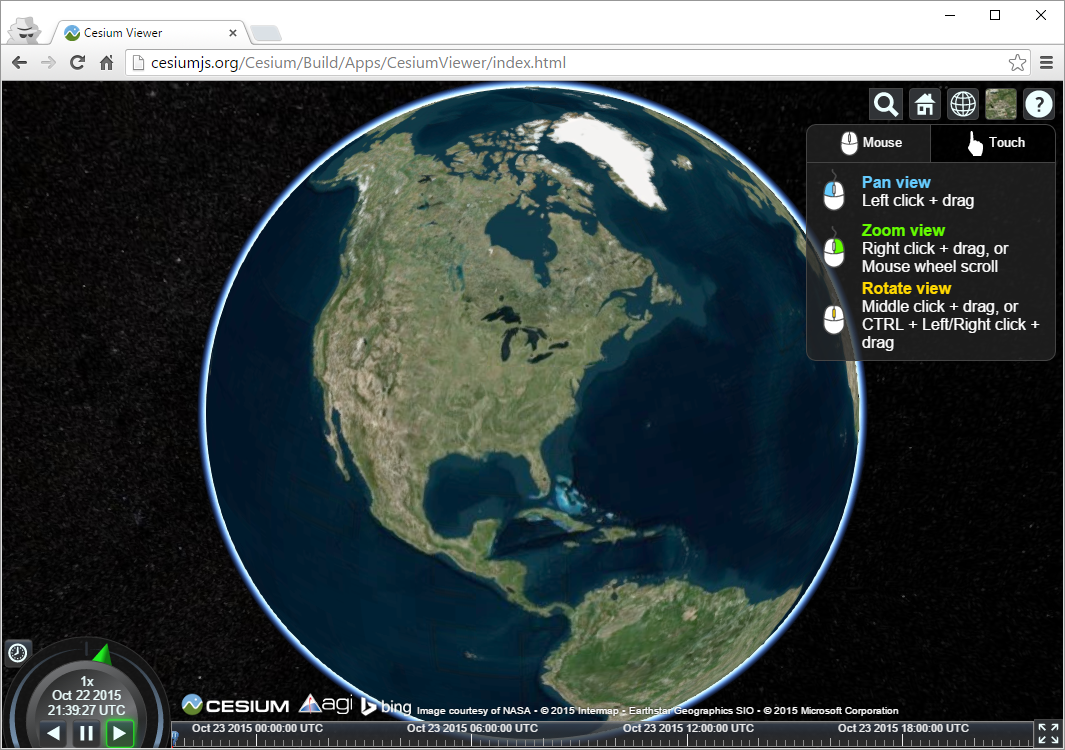
Cesium
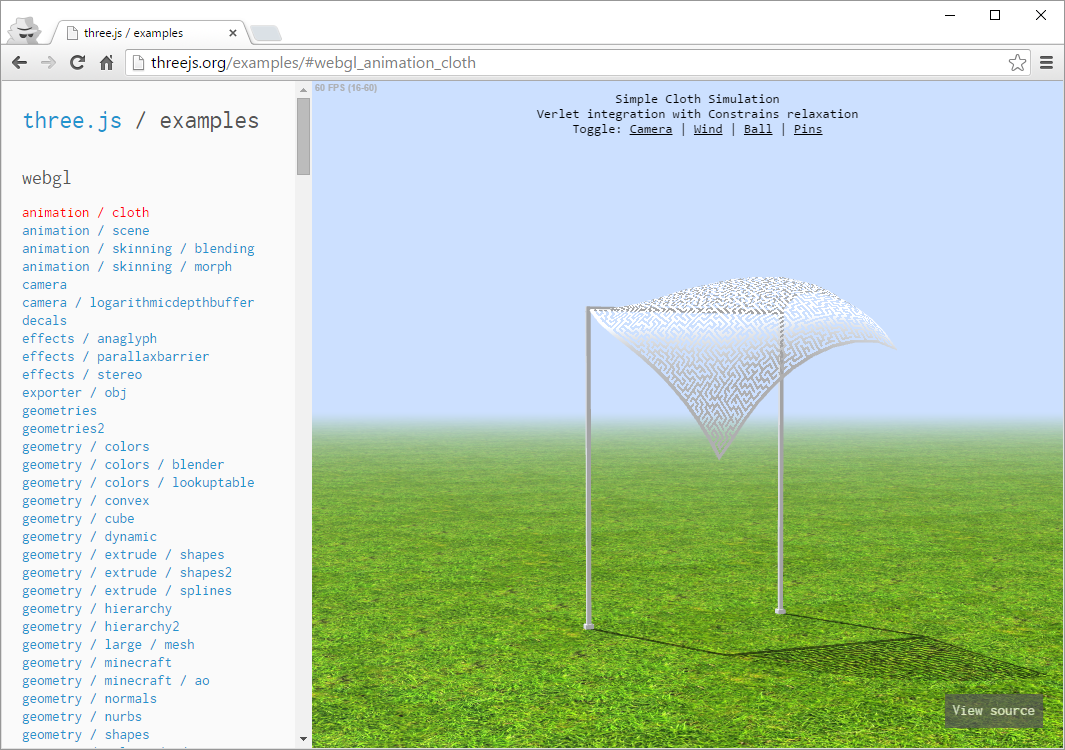
Three.js
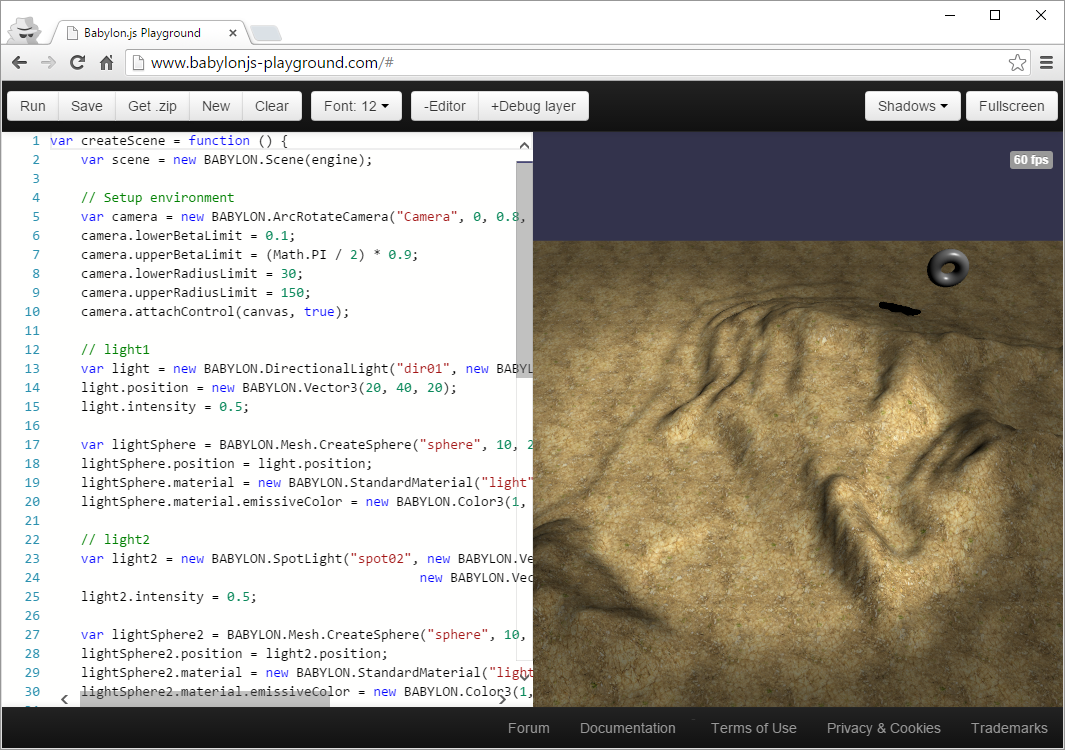
BabylonJS
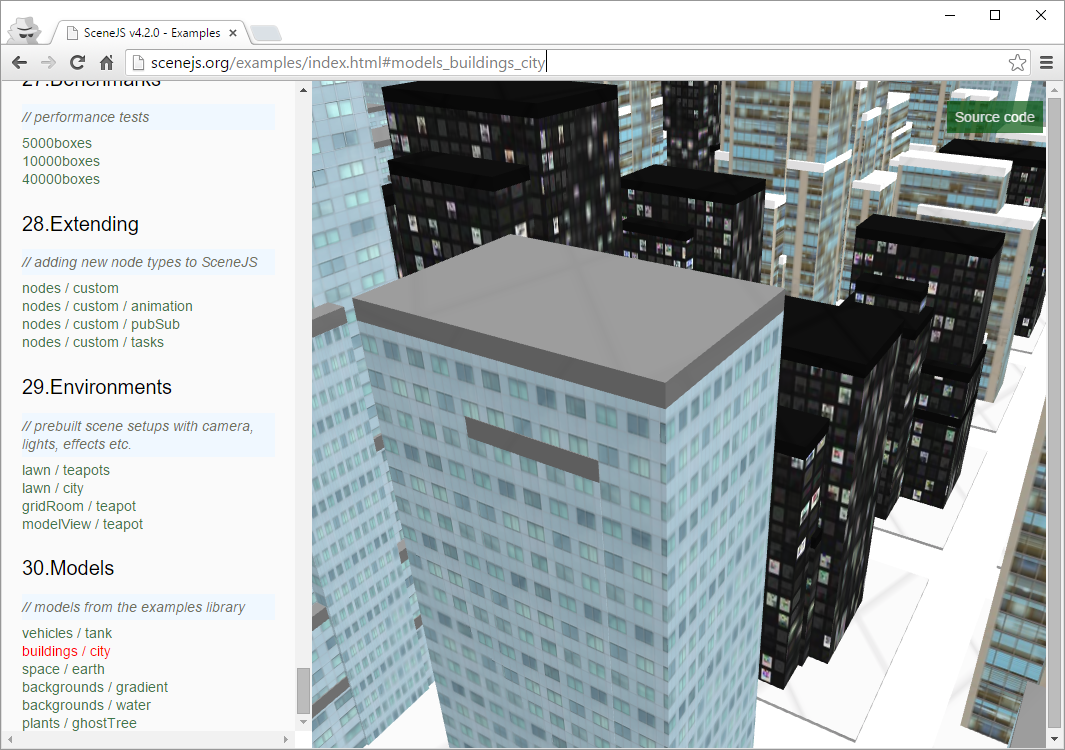
SceneJS
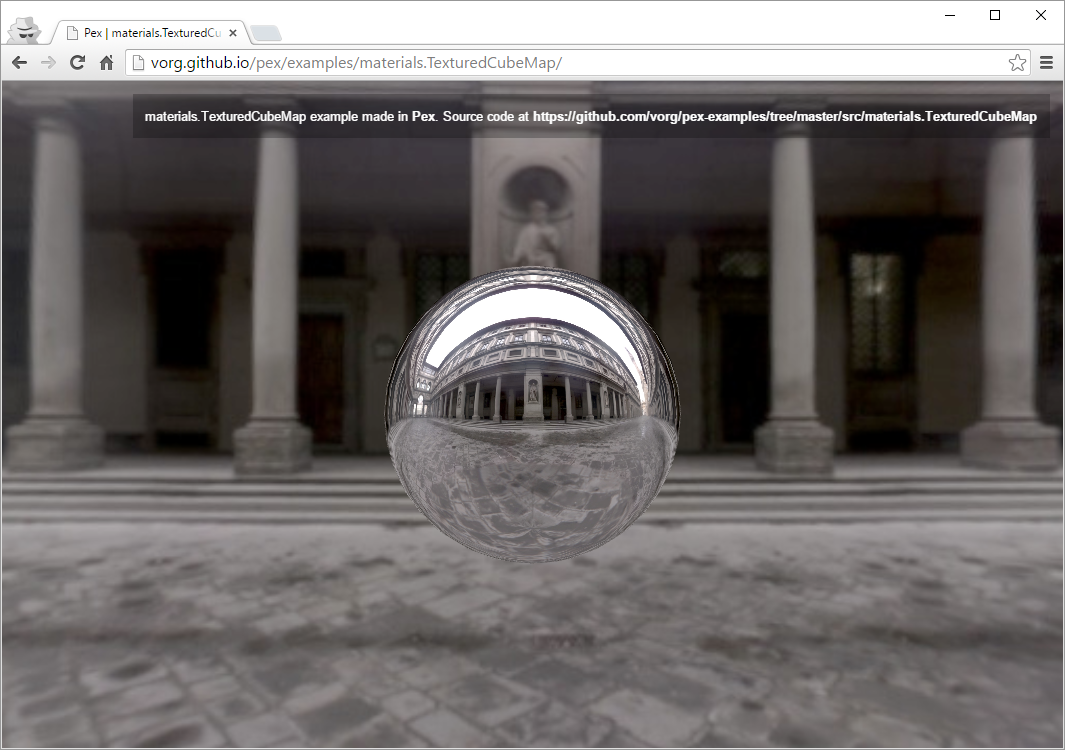
PEX
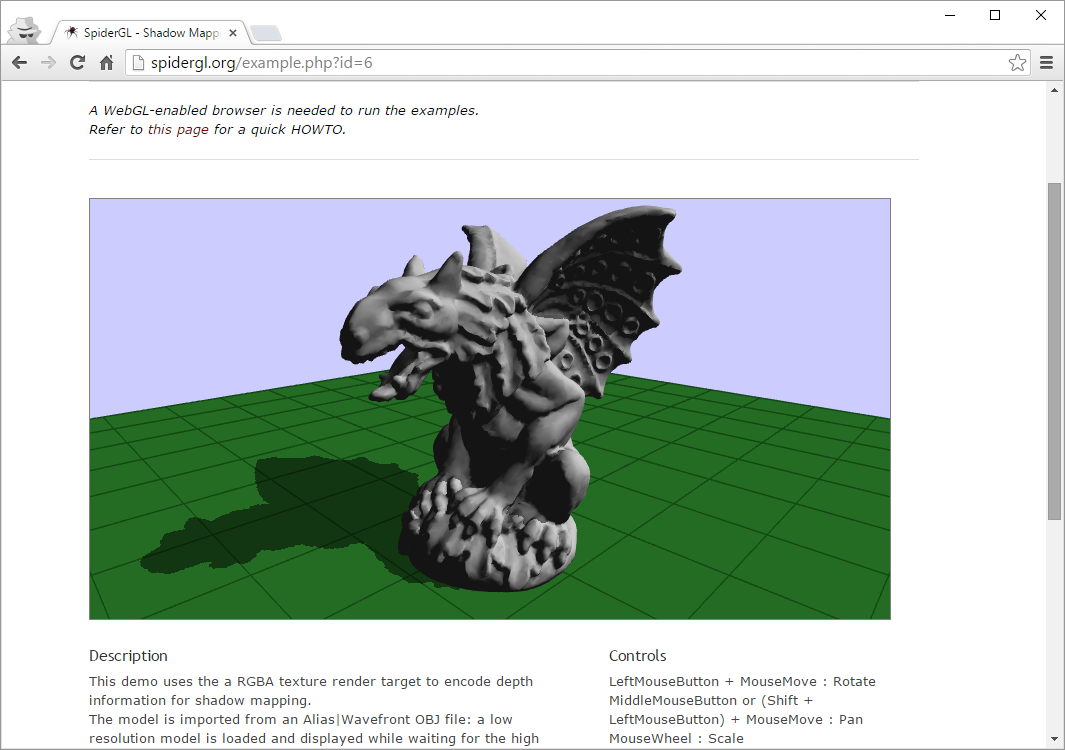
SpiderGL
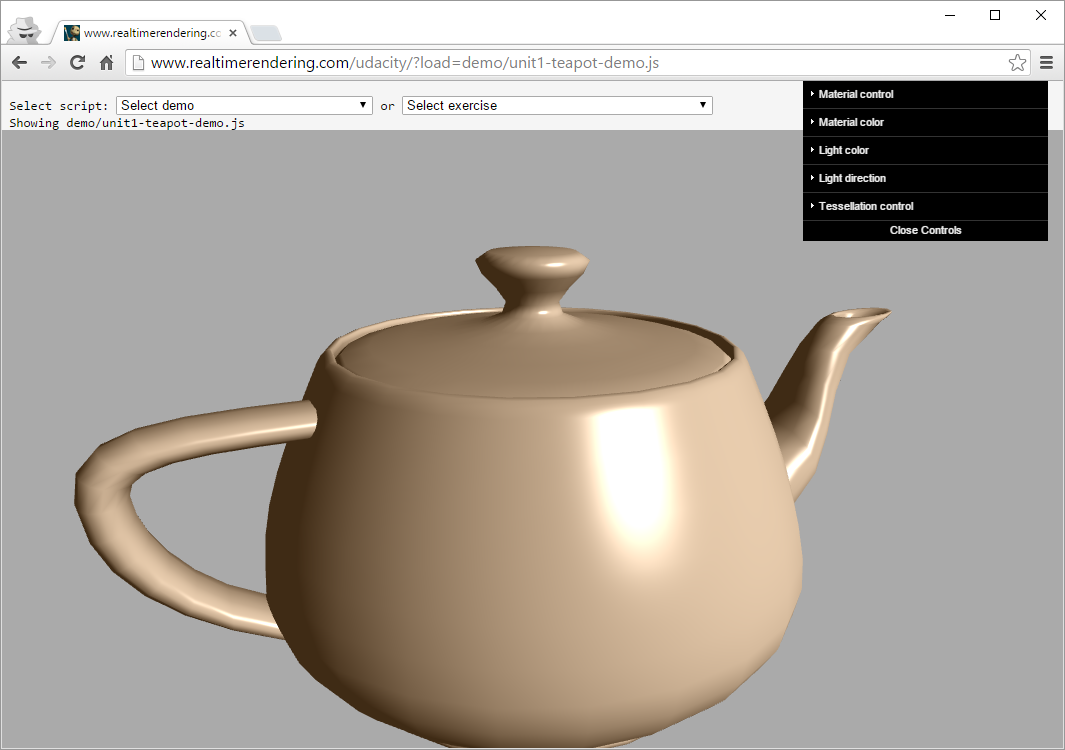
Udacity Interactive 3D Graphics Demos
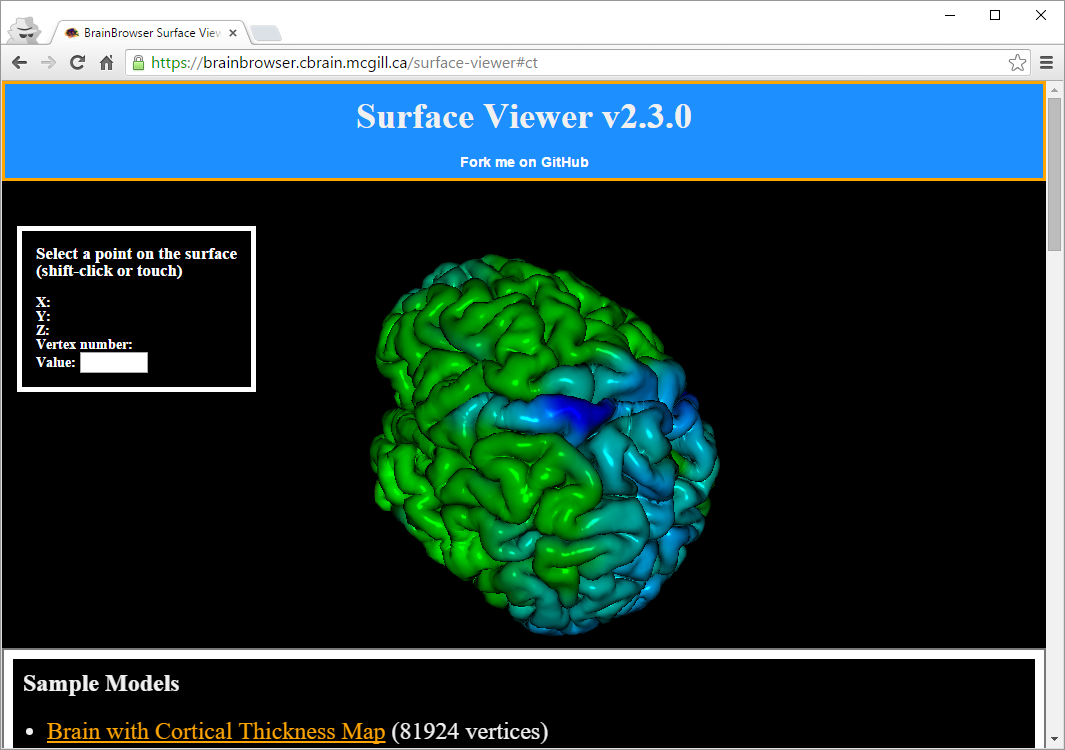
BrainBrowser
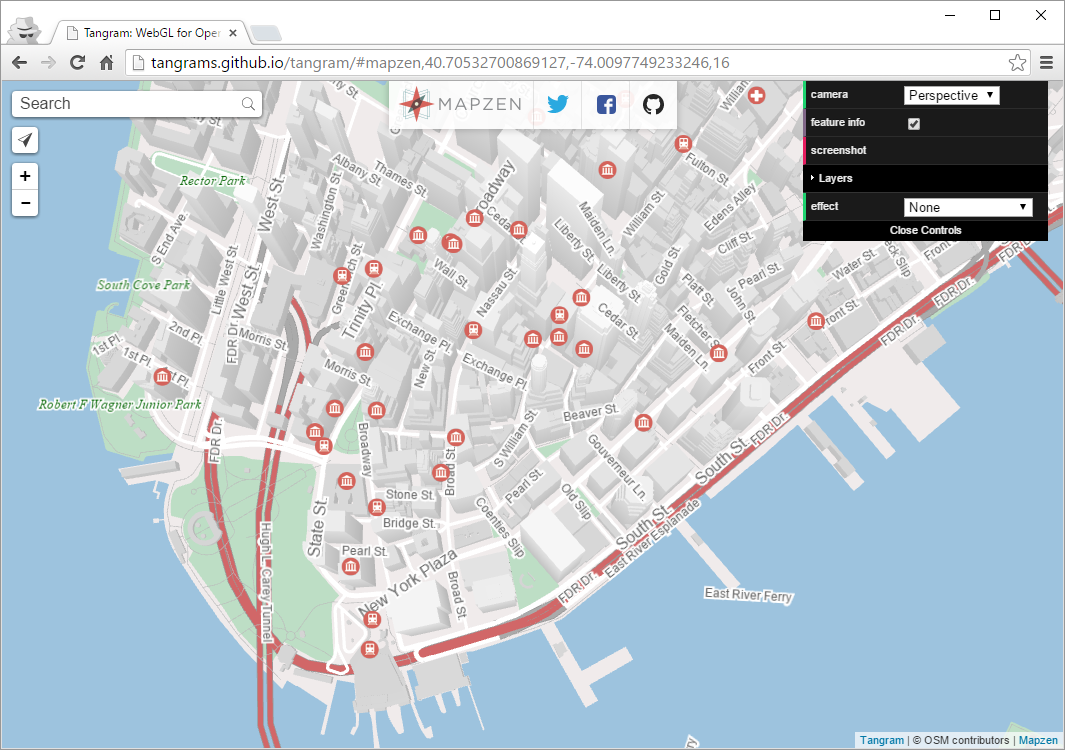
Tangram
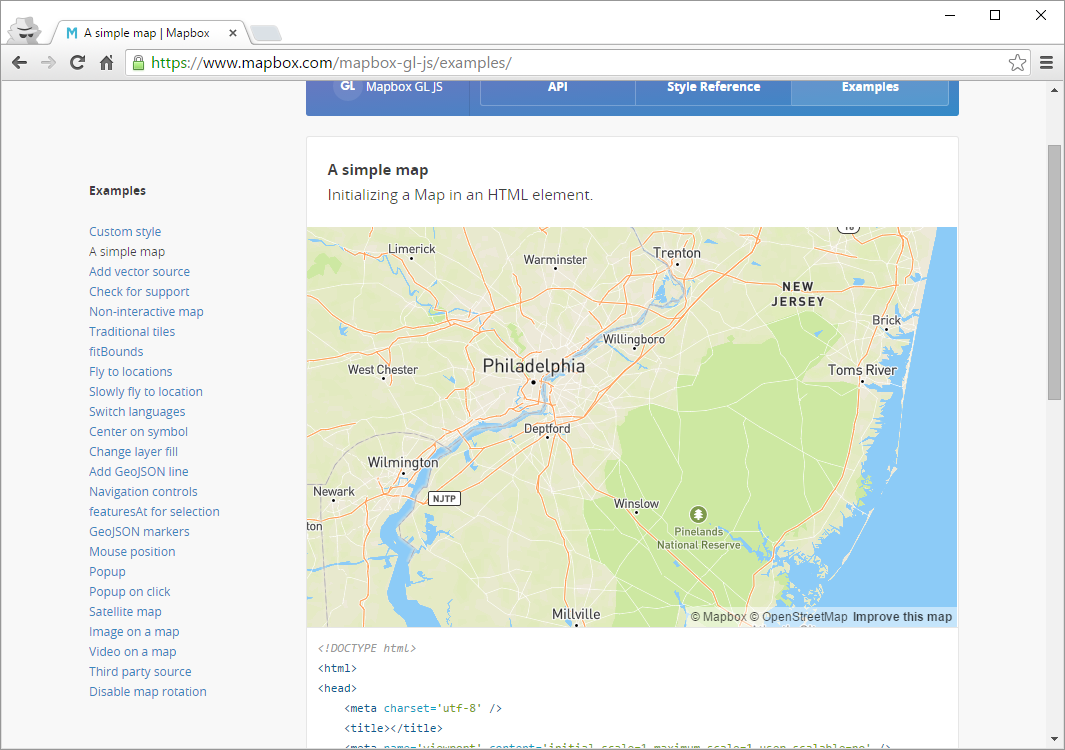
MapBox GL JS
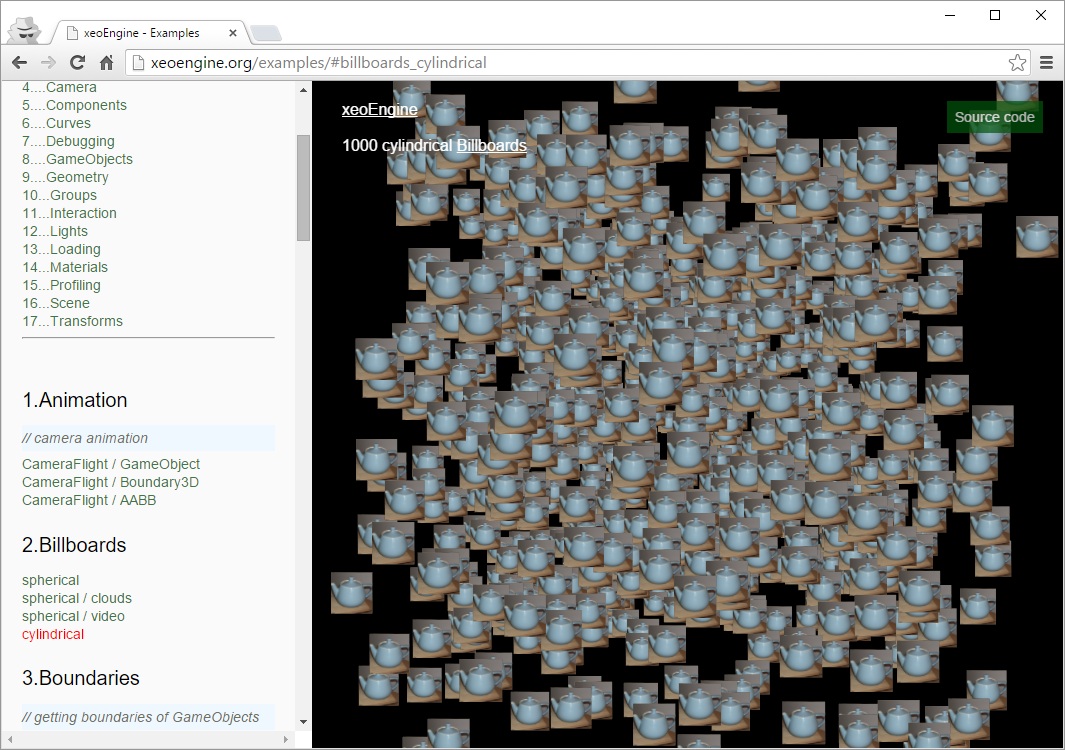
xeoEngine
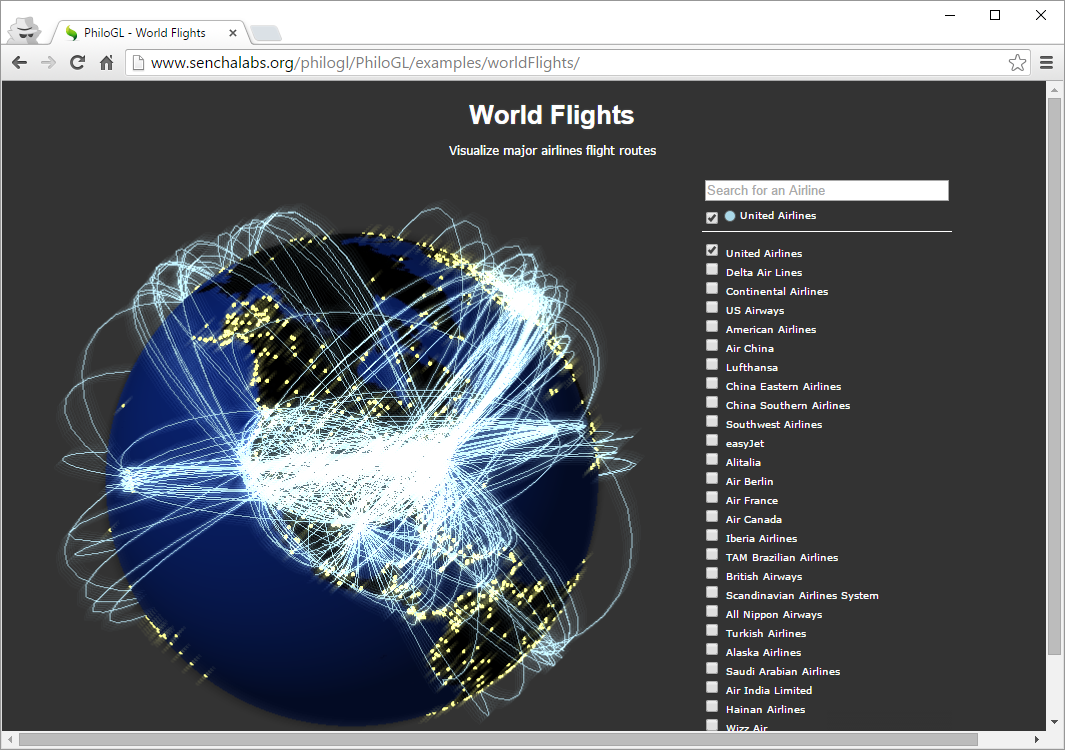
PhiloGL
M.GRL
Software Rendering
To profile with software rendering, enable swiftshader in Chrome. Close all Chrome tabs and make sure there are no Chrome processes left running. Then restart Chrome from the command line with --blacklist-accelerated-compositing --blacklist-webgl arguments. Browse to about:gpu to see if it worked. It will take a few minutes for Chrome to download swiftshader. During this time, no WebGL support will be reported.
Reading
- WebGL Debugging and Profiling Tools by Patrick Cozzi
- Graphics Pipeline Performance by Cem Cebenoyan