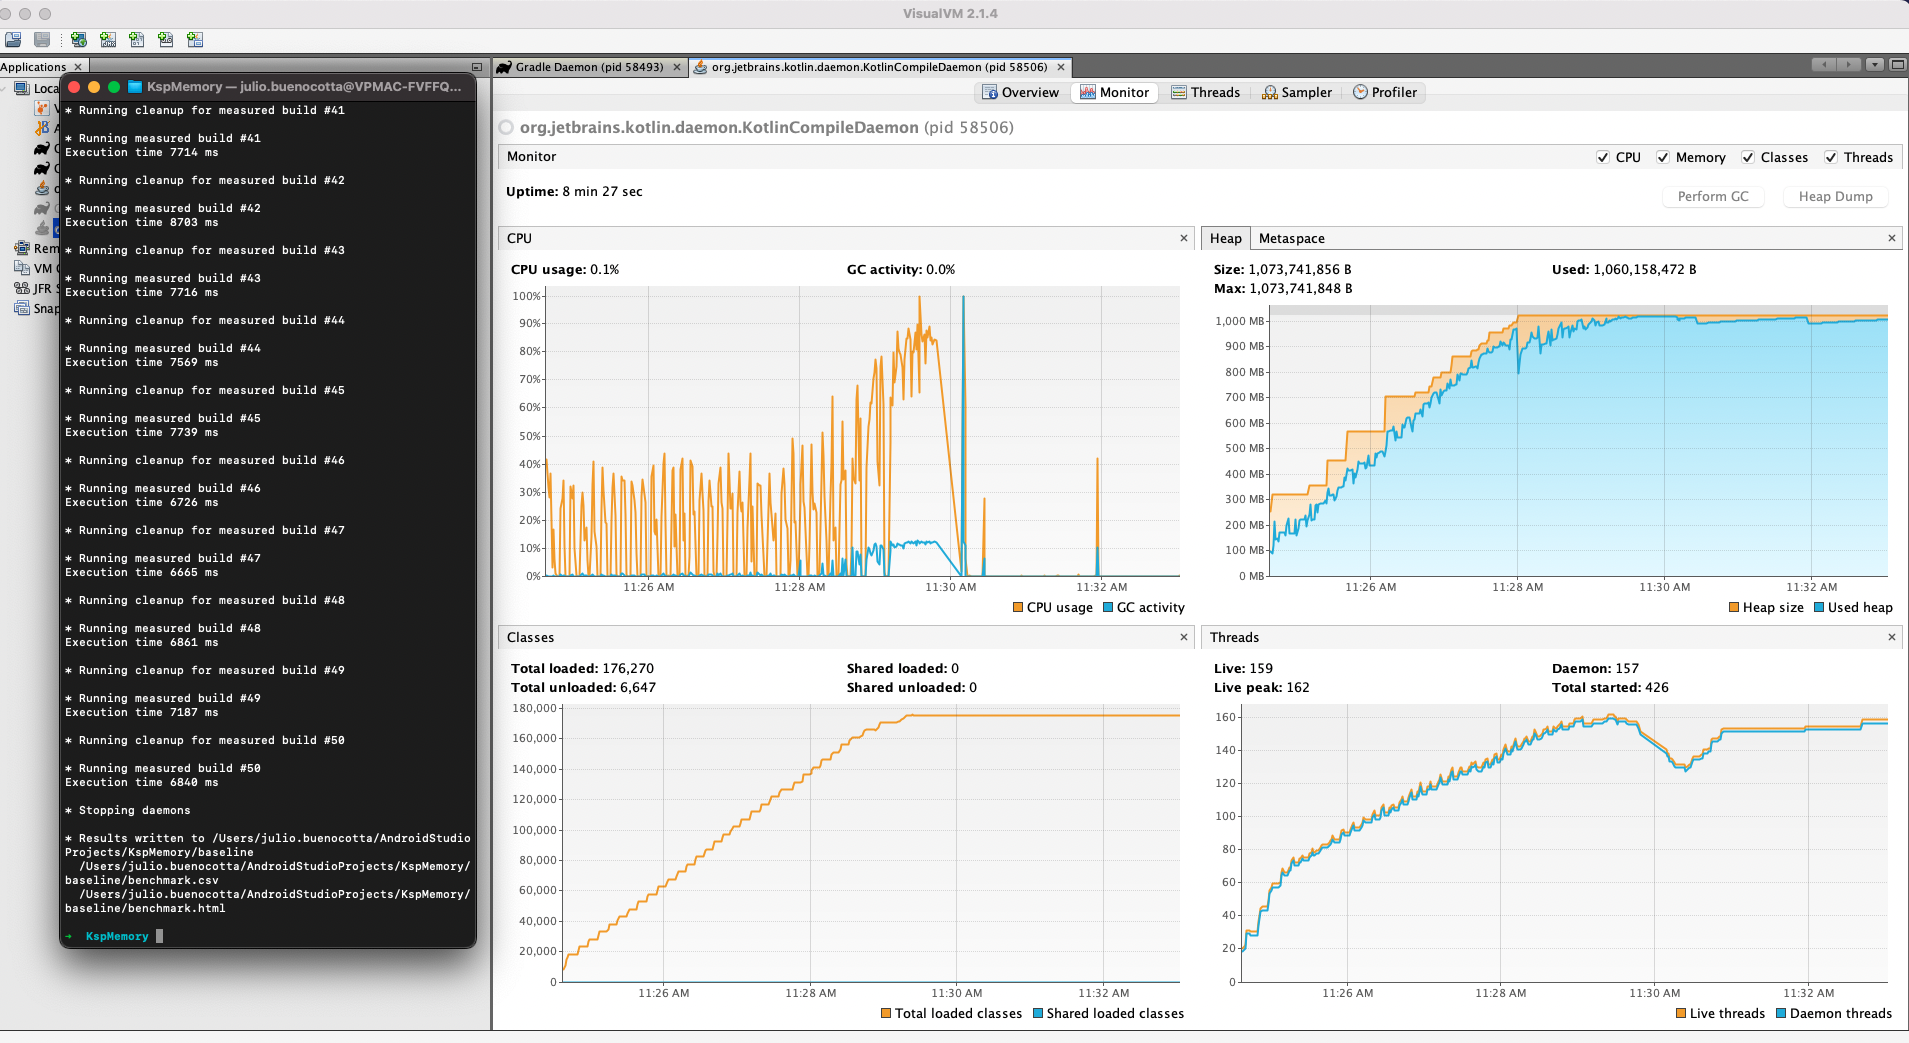
I noticed some behaviour when running gradle profiler benchmark that I am not sure if it is the desired one. kotlin daemon memory usage and live threads keep increasing when ksp is enabled. The only library using ksp in the project is room and I run the benchmark 50 times to check if the memory usage would stabilise at some point as I am just compiling the app over and over (without changes in the code) and as you can see by the image below the memory usage keeps increasing for each iteration of the benchmark. These charts are from a sample project that I can share and the GC starts to be noticeable around the 25th compilation for this project, but much earlier for other configs/projects. I would expect the amount of memory used to be stable around the 4th or 5th compilation. Is it normal? Should I open an issue at ksp repo ? room issue tracker? jetbrains issue tracker?
As you can see from this run replacing ksp with kapt makes the kotlin daemon memory pattern way more well behaved. So it seems not to be linked with the kotlin daemon itself.

How to run the benchmark
- Install gradle profiler, I recommend using SDKMAN -> https://sdkman.io/sdks#gradleprofiler
- run ./run_benchmark.sh
I used https://visualvm.github.io/ to monitor the memory usage of the build