In this lesson, we'll review all the steps we should take and all the things we should focus on when scrubbing our data.
You will be able to:
- Cast columns to the appropriate data types
- Identify and deal with null values appropriately
- Remove unnecessary columns
- Check for and deal with multicollinearity
- Normalize our data
During the process of working with data, we'll always reach a point where we've gathered all the data we'll need (our "Obtain" step), but the data is not yet in a format where we can use it for modeling. All the work that we'll be doing in the next lab will be to get our dataset in a format that we can easily explore and build models with.
When building model for predictive purposes, more data is always better when training the final model. However, during the development process when working with large datasets, its common to work with only a subsample of the dataset. Building a model is an iterative process--often, you fit the model, investigate the results, then train the model again with some small tweaks based on what you noticed. Since this is an iterative process, we want to avoid long runtimes, and iterate as quickly as possible. When we're satisfied with the model we've built on the subsample of data, then we would fit the model on the entire dataset.
In the next lab, we'll work with a subsample of the dataset to increase our iteration speed moving forward.
One of the most common problems we'll need to deal with during the data scrubbing step is columns that are encoded as the wrong data type. Generally, we see numeric data that is mistakenly encoded as string data (making each numeric value a category in its own right), or categorical data encoded as integer values. Both of these are problems we'll want to deal with.
Before we can deal with these sorts of problems, we need to detect them first.
Recall that we can get a print out of metadata for our DataFrame by calling df.info(). This will tell what type of data each column contains, as well as the number of values contained within that column (which can also help us identify columns that contain missing data)! Take a look at this example output from df.info() that we'll see in the next lab:
<class 'pandas.core.frame.DataFrame'>
Int64Index: 97839 entries, 0 to 97838
Data columns (total 16 columns):
Store           97839 non-null object
Dept            97839 non-null object
Date            97839 non-null object
Weekly_Sales    97839 non-null float64
IsHoliday       97839 non-null bool
Type            97839 non-null object
Size            97839 non-null int64
Temperature     97839 non-null float64
Fuel_Price      97839 non-null float64
MarkDown1       35013 non-null float64
MarkDown2       27232 non-null float64
MarkDown3       32513 non-null float64
MarkDown4       34485 non-null float64
MarkDown5       35013 non-null float64
CPI             97839 non-null float64
Unemployment    97839 non-null float64
dtypes: bool(1), float64(10), int64(1), object(4)
memory usage: 12.0+ MB
What do you notice about this dataset? A good next step would be to look at examples from each column encoded as strings (remember, pandas refers to string columns as object) and confirm that this data is supposed to be encoded as strings.
It is usually also a good idea to check integer columns to ensure that the data it contains is meant to represent actual numeric data, and is not just categorical data encoded as integers.
Solving this problem is pretty straightforward--we just need to cast the string data to a numeric type. Note that often times, the entire column is encoded as a string because of a single cell that contains a letter or non-numeric character such as a comma. Recall that when numpy sees multiple data types in an array, it defaults to casting everything as a string. If you try to cast a column from string to numeric data types and get an error, consider checking the unqiue values in that column--it's likely that you may have a single letter hiding out somewhere that needs to be removed!
It's also common to see categorical data encoded as integers. Given that a big step in the data cleaning process is to convert all categorical columns to numeric equivalents, this may not seem like a problem at first glance. However, leaving categorical data encoded as integers can have a negative effect by introducing bad information into our model. This is because integer encoding mistakenly adds mathematical relationships between the different categories--our model may mistakenly think that the category represented by the integer 4 twice as much as category 2, and so on.
The best way of dealing with this problem is to cast the entire column to a string data type, which will better represent the column's categorical nature. Since it's categorical, we will then deal with correctly when we one-hot encode categorical data later in the process.
The following example shows the syntax necessary for converting a column from one data type to another:
# Cast to a numeric type
df['Some_Column'] = df.['Some_column'].astype("float32")

# Cast back to a string type
df['Some_Column'] = df.['Some_column'].astype("str")We also need to check for and deal with any missing values. Recall from previous labs that pandas denotes missing values as NaN.
We can easily check how many missing values are contained within each column by getting having pandas create a truth table where the cells that contain NaN are marked as True and everything else is marked as False.
# Create truth table for missing values
df.isna()
Since False=0 and True=1 in programming, we can then sum() these truth tables to get a column-by-column count of the number of missing values in the dataset.
# Check how many missing values in each column
df.isna().sum()
Recall that our dataset may also contain null values that are denoted by placeholder values. Most datasets that do this will make mention of this in the dataset's data dictionary. However, you may also see these denoted by extreme values that dont make sense (e.g. a peron's weight being set to something like 0 or 10000). We can detect these by checking for outliers in numeric columns.
Recall that we have different strategies for dealing with null values, and that null values aren't always a bad thing--sometimes, the very absence of information tells us something!
In order to build a model on the dataset, we'll have to make sure that the dataset contains no NaN values in any cells. We can deal with these in the following ways:
Recall that we can eliminate null values by removing the offending columns and/or rows from our dataset.
-Removing Data-
- Drop rows that contain null values, if there aren't many and we are still left with alot of good data
- Drop columns that contain a disproportionate amount of null values.
Recall that we can also replace null values with other values, and that the strategies for doing so depend on the type of the data in question:
-Numeric Data-
- Replacing Nulls with column median
- Binning data and converting columns to categorical format (Coarse Classification)
-Categorical Data-
- Making Null values their own category
- Replacing null values with the most common category
We may also want to check that our data does not have high multicollinearity, or correlation/covariance between our predictor columns.
The easiest way to do this to build and interpret a correlation heatmap with the seaborn package
Columns with strong correlation should be dealt with by removing one of the offending columns, or by combining the columns through feature engineering (more on this later in the curriculum).
The seaborn documentation provides great example code on how to build a correlation heatmap with data stored in a pandas DataFrame.
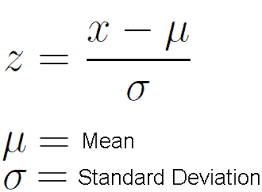
An important step during the data cleaning process is to convert all of our data to the same scale by normalizing it.
The most common form of data normalization is by converting data to z-scores.
There are also other sorts of scaling methods we can use, such as min-max normalization:
In practice, z-score normalization is the most widely used.
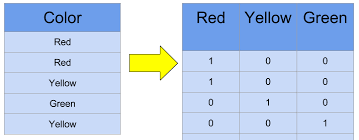
Usually, one of the final steps in data cleaning is converting categorical columns to numeric format through One-Hot Encoding.
Note that you may want to begin some parts of the Data Exploration process before one-hot encoding your data, as it's often much simpler to create visualizations when working with categorical data that has not been one-hot encoded.
We can easily one-hot encode all categorical data by using the get_dummies() function provided by pandas:
one_hot_df = pd.get_dummies(df)Great, now that we have reviewed this all, let's put this into practice!


