Statistics and R
The purpose of this project is to use R programming language to perform statistical analysis on a dataset from the automotive industry called MechaCar.
- The multiple linear regression model below takes in 5 different variables, vehicle length, vehicle weight, spoiler angle, ground clearance, and AWD, against the mpg, in order to identify which variables can be used for prediction and which ones cannot.
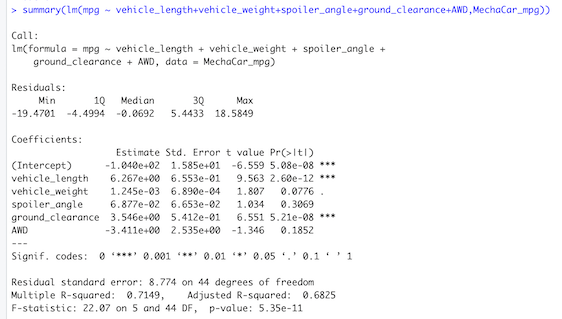
In order to identify if the slope of the linear model can be considered zero, the following multiple linear regression summary was generated:
- By examining the p-value in the last column, the only factors that are significant and account for the non-random variance are vehicle_lengthy and ground_clearance, where the p-value is being based on the traditional 0.05 for significance. While the null hypothesis in linear regression assumes a value of 0 for the coefficient, the alternative hypothesis is not 0. So, the resulted p-values suggest they have none 0 coefficients.
Does this linear model predict mpg of MechaCar prototypes effectively? Why or why not?
- For the purpose of this project it was decided that a good linear model is 0.8 or above, then we can say that the model we have does not effectively predict the mpg of MechaCar prototypes, that can be seen by looking at the Adjusted R-squared of 0.6825, which means that 68% of the variance of the mpg comes from the 5 metrics that were tested and 32% is caused by unknown factors.
The Dataframe shown below represents the suspension coil’s PSI continuous variable across all manufacturing lots.
The following lot summary shows the mean, median, variance, and standard deviation of the PSI metric for each production lot.
Does the current manufacturing data meet this design specification for all manufacturing lots in total and each lot individually? Why or why not?
- Having in consideration that the variance of the suspension coils must not exceed 100 pounds per square inch, the current manufacturing data meets this design specification when looking at the variance of the lots as a total. But it does not meet the specification when looking at them individually, where Lot3 exceeds the limit.
The reason why the data meets the specification for the lots as a total, can be explained by looking at Lot1 and Lot2 where their low values bring the average of the three lots to the accepted variance.
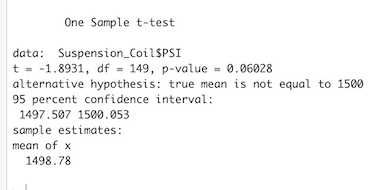
The following results were obtained by running a t-test created in order to determine if the PSI across all manufacturing lots is statistically different from the population mean of 1,500 pounds per square inch.
The data for all manufacturing lots contained 150 points which were all tested with a t-test as shown below:
Taking in consideration the decided significance level of 0.05 for the p-value, the result of 0.06028 tells that overall the Suspension Coil PSI, doesn't have a statistical difference from the population mean of 1,500, meaning that if looking at the lots as a total they pass the quality standards.
Using the t.test() function and its subset() argument to determine if the PSI for each manufacturing lot is statistically different from the population mean of 1,500 pounds per square inch.
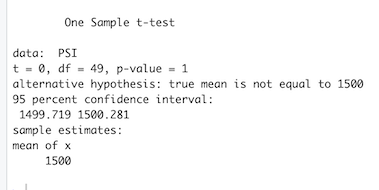
The data for Lot1 was filter out from the original dataframe, so that it could be tested individually. Containing 50 data points, Lot1 was tested with a t-test as shown below:
Taking in consideration the decided significance level of 0.05 for the p-value, the result of p-value 1 tells that the Suspension Coil PSI for Lot1 doesn't have a statistical difference from the population mean of 1,500, meaning that this lot passes the quality standards and can be used on cars.
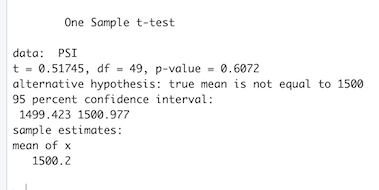
The data for Lot2 was filter out from the original, so that it could be tested individually. Containing 50 data points, Lot2 was tested with a t-test as shown below:
Taking in consideration the decided significance level of 0.05 for the p-value, the result of 0.6072 tells that the Suspension Coil PSI for Lot2 doesn't have a statistical difference from the population mean of 1,500, meaning that this lot passes the quality standards and can be used on cars.
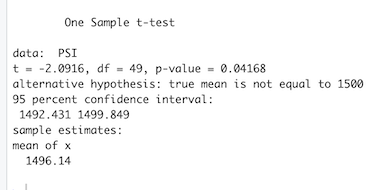
The data for Lot3 was filter out from the original, so that it could be tested individually. Containing 50 data points, Lot3 was tested with a t-test as shown below:
Taking in consideration the decided significance level of 0.05 for the p-value, the result of 0.04168 tells that the Suspension Coil PSI for lot 3 have a statistical difference from the population mean of 1,500, meaning that that this lot does not pass the quality standards and should be rejected.
This study design is intended to describe a scenario and a test type to be be used when comparing a car from MechaCar and a competitor, addressing an aspect of the car that is possibly important for the costumer when buying one.
The chosen metrics to be tested are city and highway fuel efficiency.
The goal is to find out if the mpg performance of each car is equal or different, equal meaning null hypothesis and different meaning alternative hypothesis.
To test the defined metrics, two very similar SUVs would be picked, one from MechaCar and one from a competitor such as Nissan, where their fuel efficiency for city and highway would be tested, where employees would drive each car on each of the presented scenarios multiple times and record the results for comparison.
In order to find the overall performance of each SUV being tested, a 2 way t-test would be run using the mean of the city and highway mpg results.
Another useful finding would be to run a 2 way t-test on each SUV, using a subset or filter on the type of scenario, to compare the cars against both their city and highway performance.

