Name: Ata Türkoğlu
Student ID: 150210337
- Install Python.
- Make sure you are connected to the internet as the data is fetched from the web (after the initial usage, a cache is created for offline usage as well).
- Install the required packages with pip, using the following command:
pip install -r requirements.txt - Run the
src/main.ipynbfile.
The src/itu_helper.py function is a wrapper that fetches data from ITU Helper and uses the src/data_structres/course.py and src/data_structres/lesson.py to store the data it fetches. Then, from the src/main.ipynb Jupyter Notebook file, the ItuHelper class is used for accessing the data and visualizing it using the matplotlib library.
This plot shows the distribution of capacity and the fullness for each course. We can see the majority of the courses fall in the bottom-left region where capacity is below
It is hard to talk about the bottom-left region as it is really cluttered, we'll have to take a deeper look to find something from it.
In the bottom-right region we can see the courses with the highest capacities, and, most of them are almost full, showing that there is enough lectures available for them, with few exceptions.
- We can decrease the capacity of ING 100 and DAN101.
- We need to increase the capacity for MAT 103E, FIZ 101EL and EKO 201E
This region has courses with enrollments extremely about capacity. We can see that these are mostly major-specific courses, which explains why the capacity is too low. We may need to increase their capacity by just opening one more lecture for each of them.
These two plots are follow-ups on Plot 1, the left one being the bottom-left region, and the right one being the bottom-right region.
We can see a really interesting spherical pattern occur in the bottom-left part of this plot. It is hard to explain what it is but looks interesting.
We can see there are a lot of courses with fullness between
To determine which courses need an increase in capacity, we will have to skip the courses at
Here, we can see the bottom-right part of Plot 1 more clearly, the analysis for this part will be the same as Plot 1's analysis.
- We can decrease the capacity of ING 100 and DAN101.
- We need to increase the capacity for MAT 103E, FIZ 101EL and EKO 201E
This plot is the zoomed-in version of the left plot in Plot 2. The courses above the red line need a capacity increase, below are the top-20 of them:
- MTO 451E : (
$224.00%$ full) (Oceanography) - MTO 350E : (
$190.00%$ full) (Air Pollution Fundamentals) - KMM 332 : (
$168.57%$ full) (Ayırma İşlemleri) - LAT 161 : (
$160.00%$ full) (English Composition) - MIM 4085E: (
$160.00%$ full) (Byzantine Heritage inİstanbul) - END 337E : (
$152.50%$ full) (Intr. to Operations Research) - MTO 357E : (
$150.00%$ full) (Physics of Upper Atmosphere) - ELK 214E : (
$146.67%$ full) (Fund. of Electr. Energy Conver.) - UCK 459E : (
$145.45%$ full) (Helicopter Theory) - ELK 415E : (
$140.00%$ full) (Digital Protection & Signalling) - MIM 411 : (
$140.00%$ full) (Mimari Proje VII) - UZB 318E : (
$138.33%$ full) (Finite Element Method) - ELK 411E : (
$137.78%$ full) (High Voltage Lab.) - UCK 372E : (
$137.50%$ full) (Experimental Engineering) - SNT 108 : (
$136.21%$ full) (Seramik) - ELK 493E : (
$135.00%$ full) (Lighting Tech & Photometry Lab.) - END 311E : (
$130.91%$ full) (Statistics) - MTO 464E : (
$130.00%$ full) (Climate Change) - GID 413 : (
$128.57%$ full) (Biyoteknoloji) - SNT 109 : (
$128.57%$ full) (Kazı Resim (Gravür))
In this plot, we have a pie chart for each building of the University, showing the number of enrolled students for each day of the week. Here, the data is a bit too complicated, yet we can still get some insights.
⚠️ If a student has multiple courses on the same day, there is no way to identify it so the data might include duplicated enrollment data for some students.
We can see that MED B is really busy on Tuesdays with almost
Again, there is a huge unevenness in these building's weekly distribution, but, as there aren't that many students, no adjustments are needed.
We can see that the university is less busy on Fridays and Wednesdays, with Saturday being the least busy, excluding Sunday as there are no courses on Sundays, with only 42 students enrolled.
the top-5 busiest buildings:
- Merkezi Derslik A Binası:
$19,153$ students enrolled weekly - İnşaat Binası:
$18,859$ students enrolled weekly - Fen-Edebiyat Binası:
$15,167$ students enrolled weekly - Elektrik-Elektronik Binası:
$14,501$ students enrolled weekly - Mimarlık Binası:
$14,107$ students enrolled weekly
the top-5 least busy buildings are:
- Ruhi Sarıalp Seminer Salonu-Beden Eğitimi Bölümü:
$27$ students enrolled weekly - Sağlıklı Yaşam Merkezi:
$43$ students enrolled weekly - Tenis Kortları:
$90$ students enrolled weekly - İTÜ Olimpik Stadyumu:
$90$ students enrolled weekly - Spor Salonu-Beden Eğitimi Bölümü:
$91$ students enrolled weekly
We can also calculate the average enrolled student count per day as
Buildings enrolled student count below average
- Spor Salonu-Beden Eğitimi Bölümü (
$91$ enrolled weekly) - Tenis Kortları (
$90$ enrolled weekly) - İTÜ Olimpik Stadyumu (
$90$ enrolled weekly) - Sağlıklı Yaşam Merkezi (
$43$ enrolled weekly) - Ruhi Sarıalp Seminer Salonu-Beden Eğitimi Bölümü (
$27$ enrolled weekly) - Gemi İnşaatı ve Deniz Bilimleri Binası (
$4,884$ enrolled weekly) - Konservatuvar Binası (
$3,959$ enrolled weekly) - İşletme Binası (
$161$ enrolled weekly) - Uçak ve Uzay Bilimleri Binası (
$5,336$ enrolled weekly) - Merkezi Derslik B Binası (Gölet Derslik Binası) (
$976$ enrolled weekly) - Motorlar Binası (
$283$ enrolled weekly)
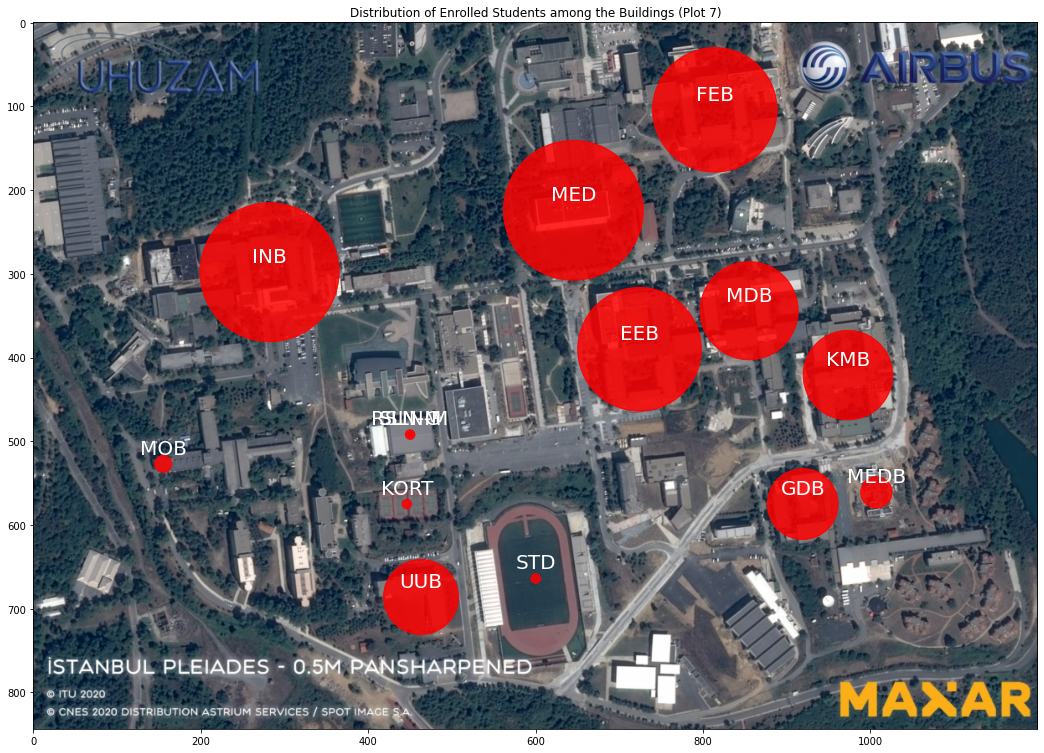
After plotting a scatter-plot over the Ayazağa Campus, we can see how the density of enrolled students is distributed on the campus, and how uneven it is. The most common buildings like EEB, MED and FEB are so close by, which creates an uneven distribution.
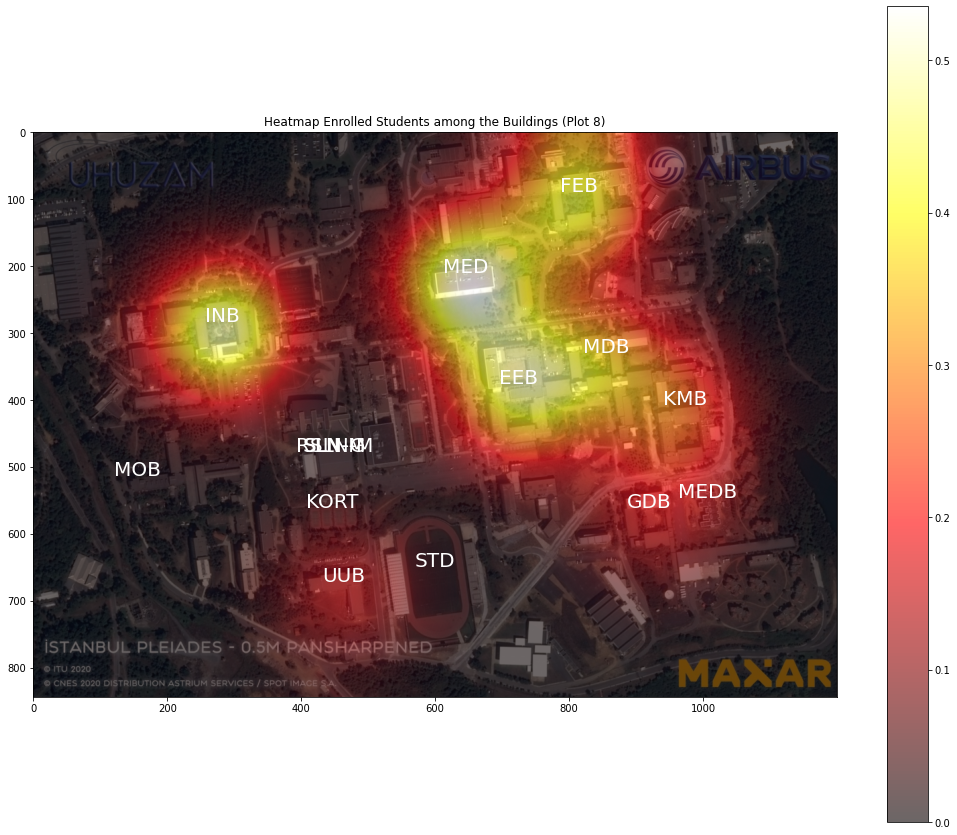
This plot is Plot 7, but with Gaussian Blur applied to create a heatmap. This way We can see the connection between nearby buildings much easier, and the huge blob between MED, FEB, EEB and MDB. When planning new buildings for the campus, this data should be considered and the new building should be away from these huge blobs.


