Smart wristbands are basic electronic products that many people own nowadays. They have a wide variety of sensors that can collect a large amount of interesting data, such as sleep patterns, physical activity, and cardiovascular health. This data often has high analytical and development value.
For example, you can automatically activate the "do not disturb" mode on your phone after falling asleep and turn it off when you wake up. Or you can monitor your heart rate changes to control a treadmill for steady-state running. Or you can monitor blood oxygen saturation and send an alert when abnormalities occur.
So, it is very necessary to expand your smart wristband. And this repository provides a solution:
It supports the Amazfit GTR 4 wristband, running a background service in the wristband that scans the data of various sensors every 5 minutes and sends it to a custom HTTP server. Similarly, this repository also provides the HTTP data cache server.
Using this solution, you can perfectly retrieve your health data using HTTP API, use it for further expansion and development, or export it to Prometheus.
The following script will install\update this app on your Ubuntu server. Supports Ubuntu 22.04.
On your Ubuntu server, run the following command:
curl -sL https://gitlab.aiursoft.cn/anduin/sleepagent/-/raw/master/install.sh | sudo bashOf course it is suggested that append a custom port number to the command:
curl -sL https://gitlab.aiursoft.cn/anduin/sleepagent/-/raw/master/install.sh | sudo bash -s 8080It will install the app as a systemd service, and start it automatically. Binary files will be located at /opt/apps. Service files will be located at /etc/systemd/system.
Requirements about how to run
- Install .NET 7 SDK and Node.js.
- Execute
npm installatwwwrootfolder to install the dependencies. - Execute
dotnet runto run the app. - Use your browser to view http://localhost:5000.
- Open the
.slnfile in the project path. - Press
F5to run the app.
First, install Docker here.
Then run the following commands in a Linux shell:
image=hub.aiursoft.cn/anduin/sleepagent
appName=sleepagent
docker pull $image
docker run -d --name $appName --restart unless-stopped -p 5000:5000 -v /var/www/$appName:/data $image
That will start a web server at http://localhost:5000 and you can test the app.
The docker image has the following context:
| Properties | Value |
|---|---|
| Image | hub.aiursoft.cn/anduin/sleepagent |
| Ports | 5000 |
| Binary path | /app |
| Data path | /data |
| Config path | /data/appsettings.json |
Of course you need to own a ZEPP watch to use this solution. Please buy the Amazfit GTR 4.
Costs around 1000 RMB.
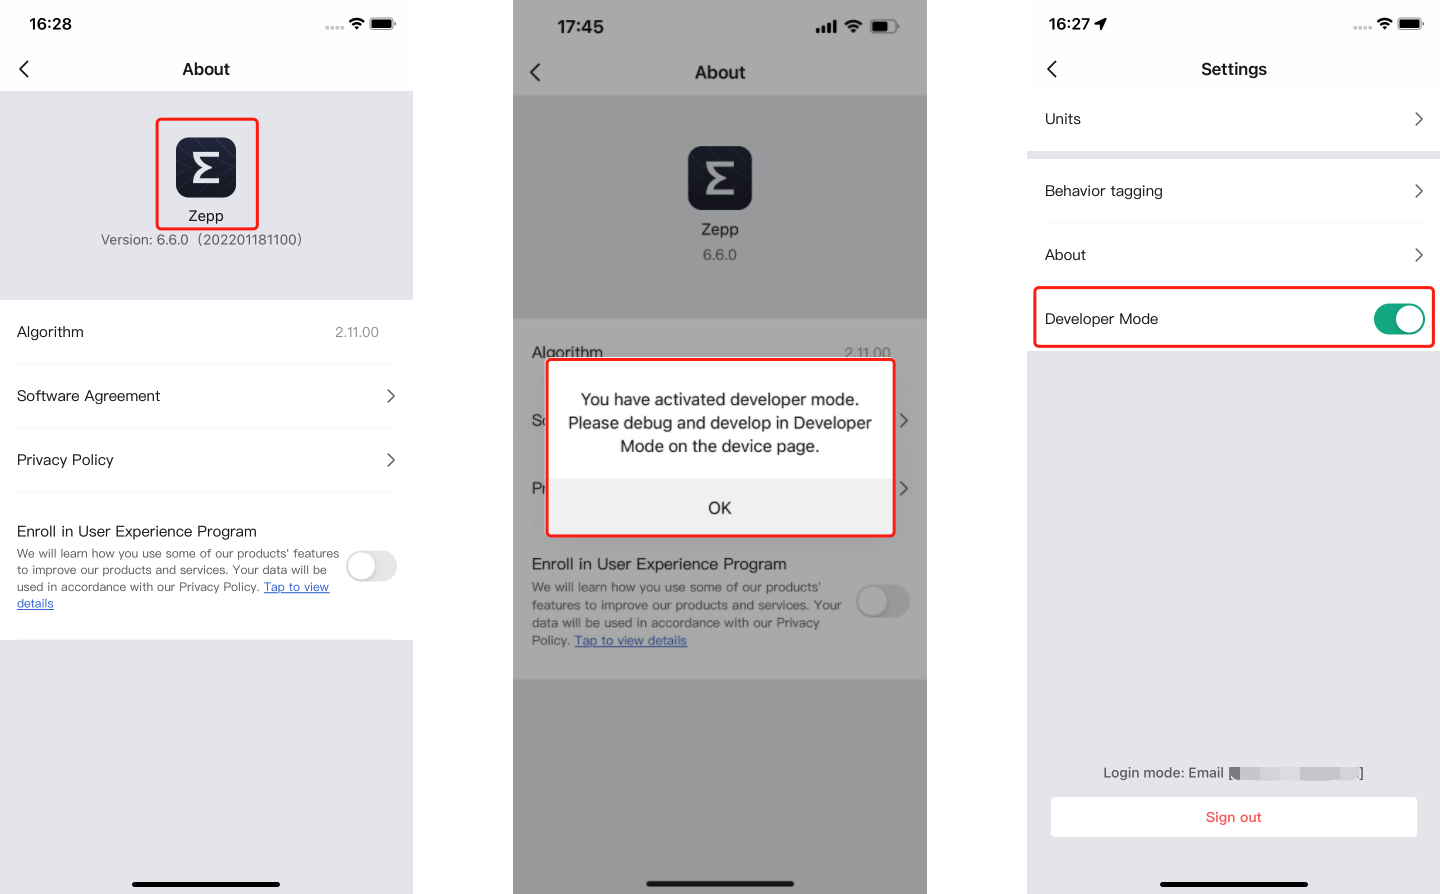
You need to enable the developer mode on your watch.
Go to Settings -> About, then tap the logo 10 times.
Now you can see the developer mode.
Of course, you need to deploy the server to store the sleep data.
Buy or deploy a Ubuntu 22.04 server. Deploy with any approaches above.
- Deploy with a single script
- Deploy manually
- Deploy with Docker
And get the server's endpoint. For example, http://your-server.com.
This will be the endpoint that the app will send the sleep data to.
You need to edit, build the app and install it on your phone.
First, install Node.js and NPM on your computer.
# Assuming you are using Windows
winget install -e --id Node.js
Then, install the ZEUS CLI tool:
npm i @zeppos/zeus-cli -gNow change the endpoint to your own server's endpoint in the ./src/Anduin.SleepAgent.ClockApp/app-service/background_service.js file.
const endPoint = "http://your-server.com/api/metrics/send"If you want to use our server, you can skip this step, or keep the value:
const endPoint = "https://health.aiursoft.cn/api/metrics/send"The app will send the sleep data to this endpoint.
Now, build the app:
cd ./src/Anduin.SleepAgent.ClockApp
npm install
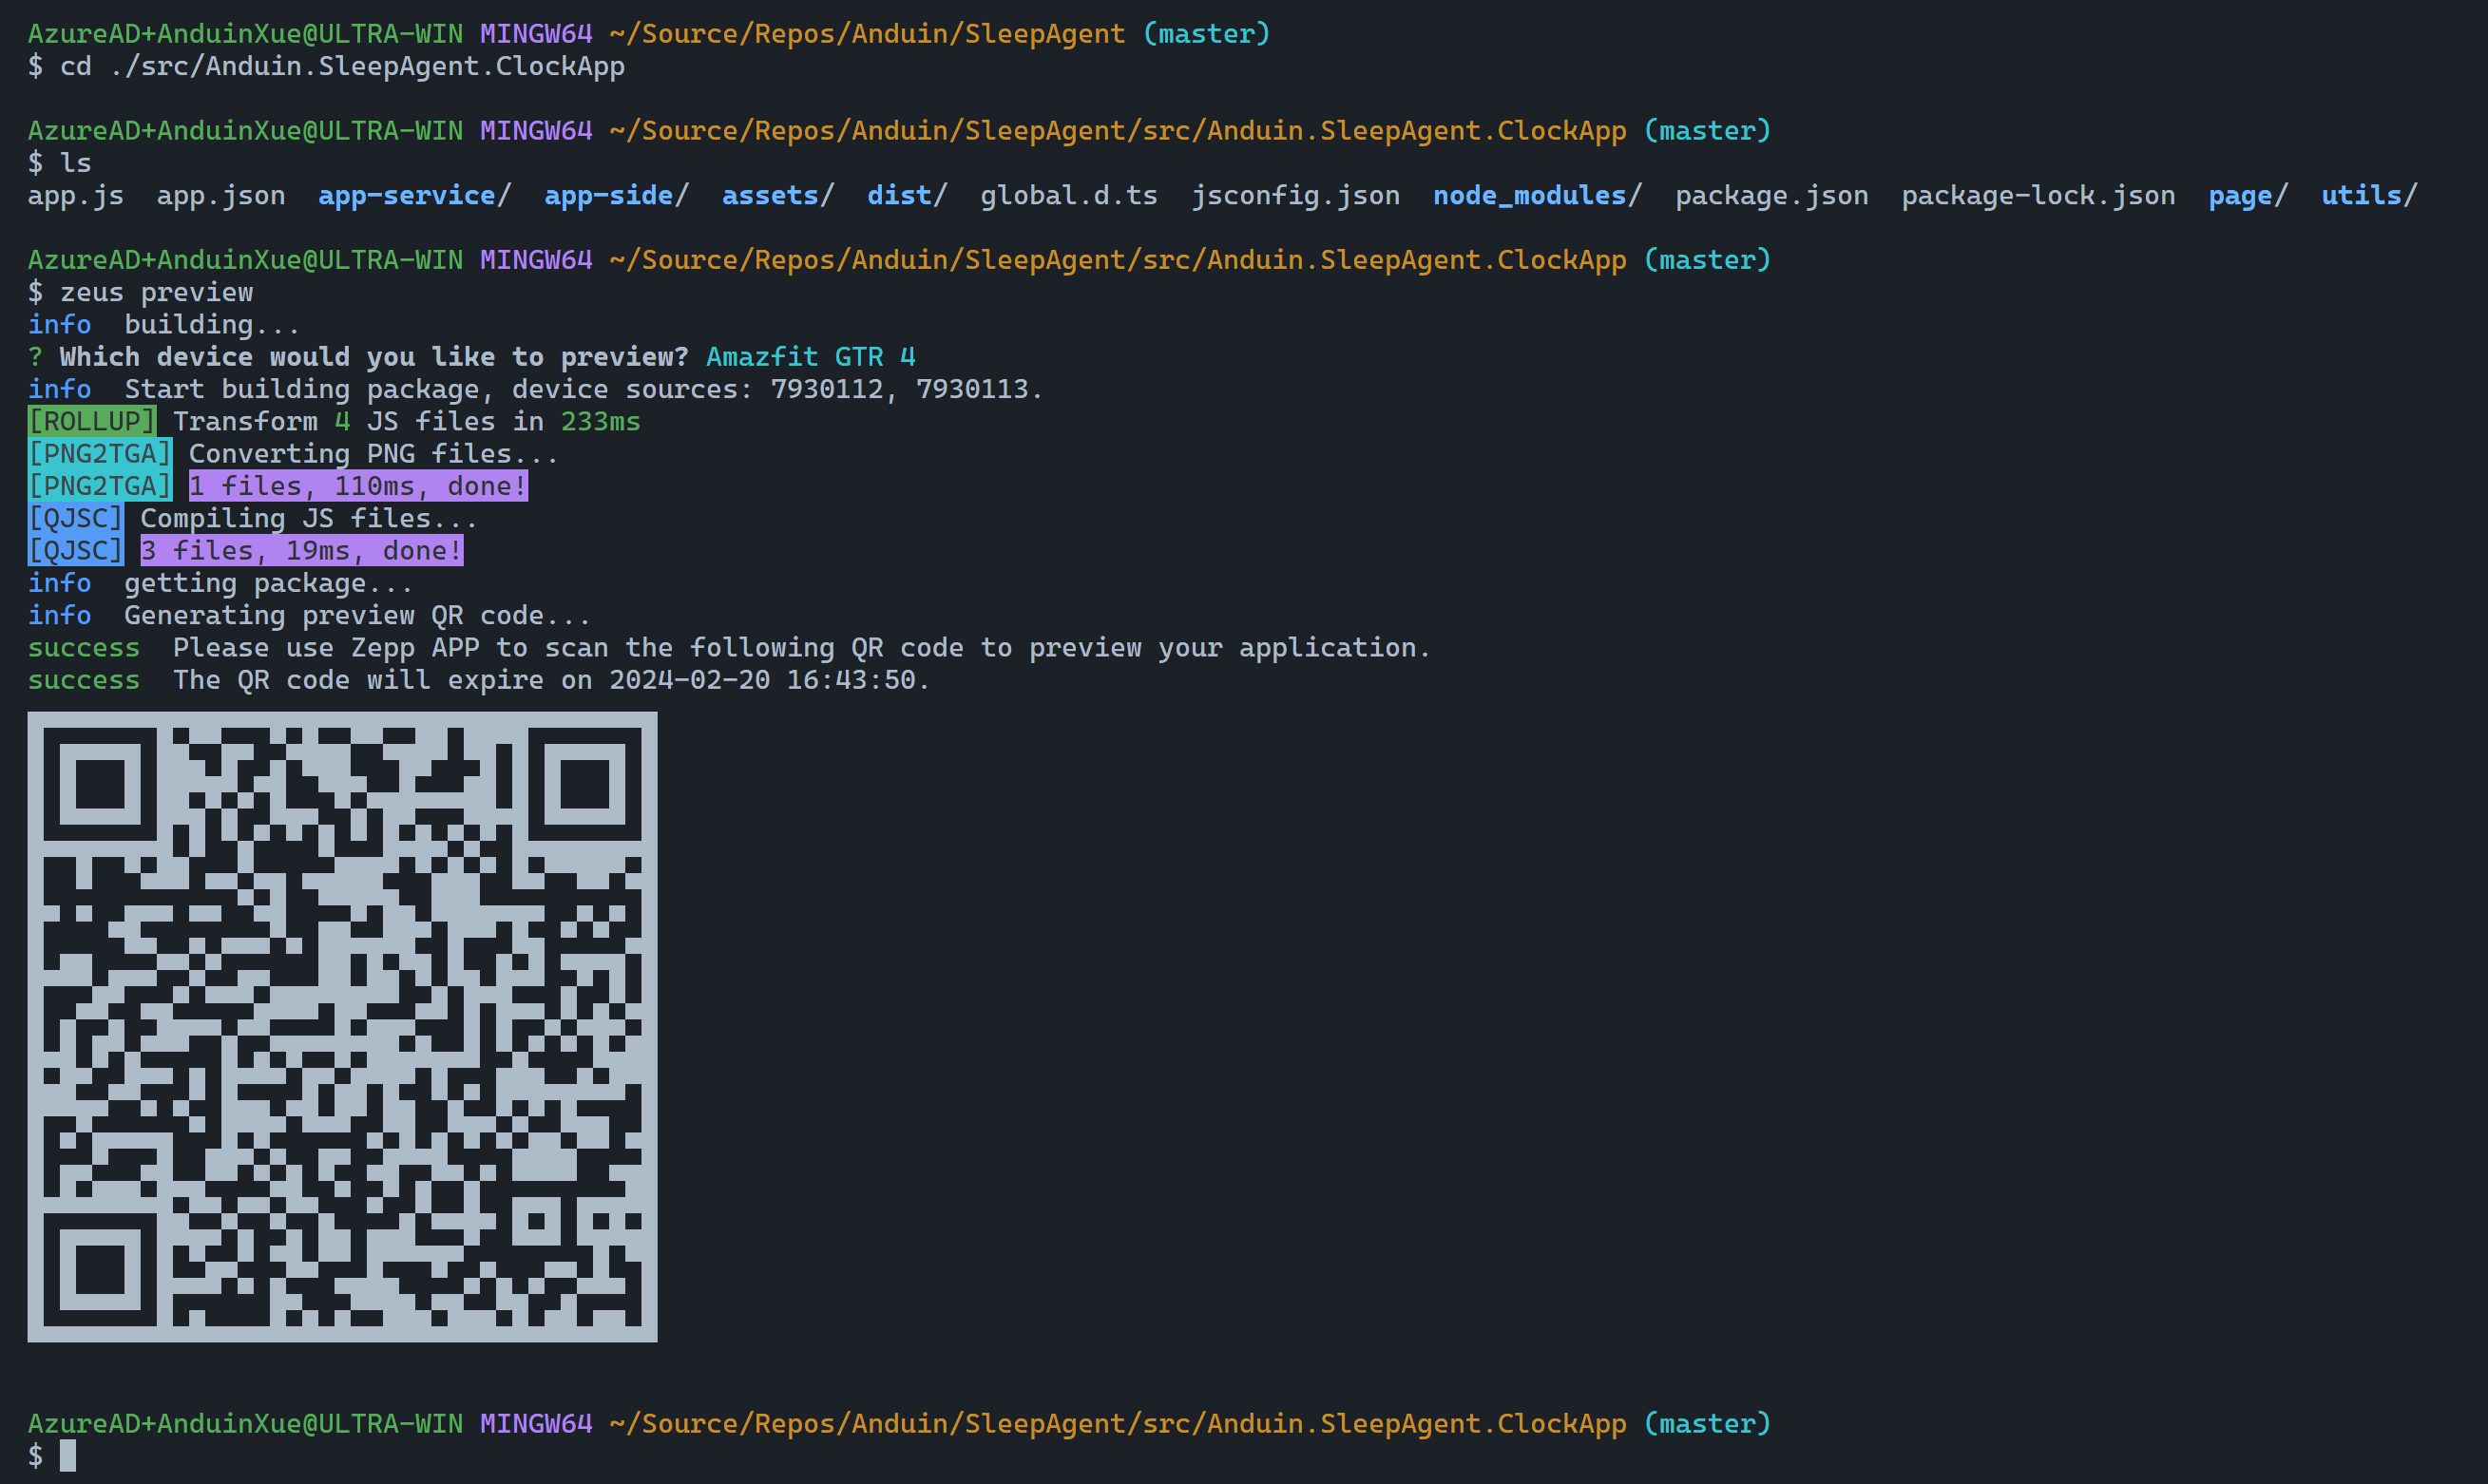
zeus preview
Now you will see a QR code.
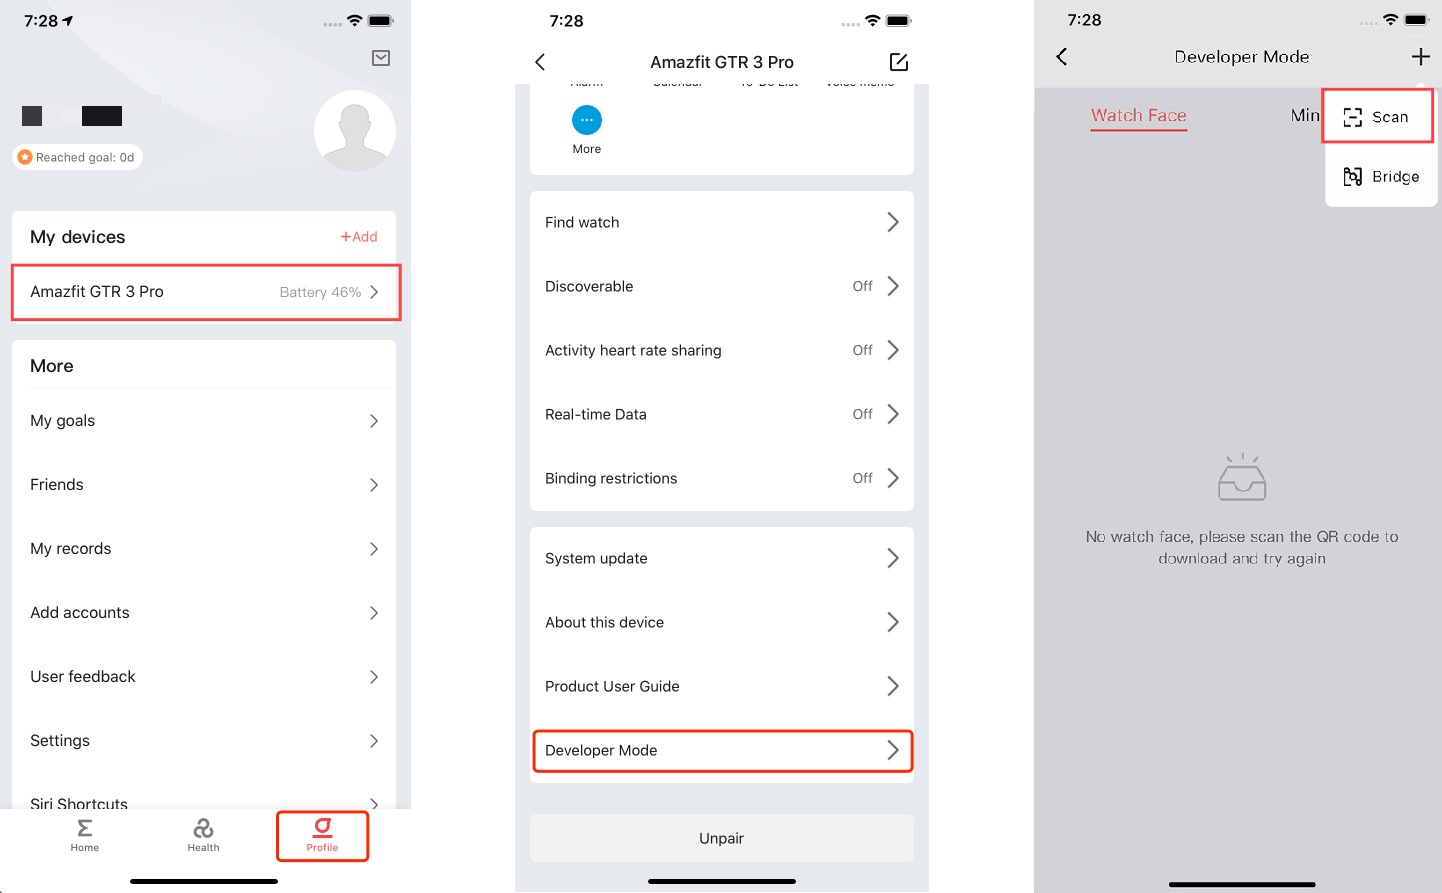
Open the ZEPP app on your phone, and scan the QR code.
Now you can see the app on your watch's app list.
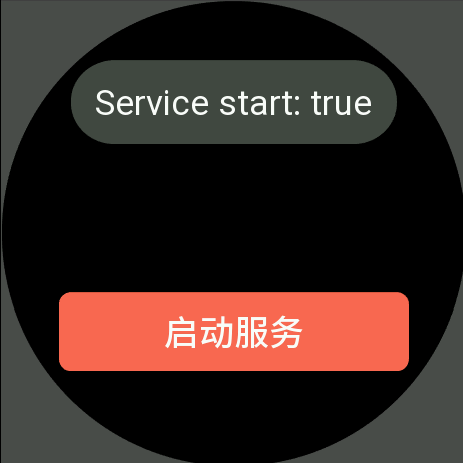
Open the app on your watch, click the start button, and the app will start to send the sleep data to your server.
And you must disable the Enable Sleep Mode feature in the clock: Sleep -> Settings -> Sleep Plan -> Enable Sleep Mode. This is because the app will not work when the watch is in sleep mode.
And NEVER enter sleep mode for your watch!!! Because the app will stop working when the watch is in sleep mode.
Wait 5-10 minutes, and you can view the metrics data on your server.
Open your browser and navigate to http://your-server.com/api/metrics/all.
If you are using our server, you can navigate to https://health.aiursoft.cn/api/metrics/all.
You will see the users list which has sent the sleep data to your server.
[
    "SomeUser",
    "SomeOtherUser"
]
To view one user's data, navigate to /api/metrics/query?nick-name=SomeUser.
You may see:
// View https://docs.zepp.com/docs/reference/device-app-api/newAPI/sensor/Sleep/ for more information
{
    "user": {
        "age": 30,
        "height": 1.80, // Meters
        "weight": 75.0, // KG
        "gender": 0, // 0 is male, 1 is female
        "nickName": "UserName",
        "region": "cn",
        "birth": {
            "year": 1990,
            "month": 1,
            "day": 1
        }
    },
    "device": {
        "width": 466,
        "height": 466,
        "screenShape": 1,
        "deviceName": "Amazfit GTR 4",
        "keyNumber": 2,
        "keyType": "normal_21",
        "deviceSource": 7930222,
        "deviceColor": 3,
        "productId": 121,
        "productVer": 256,
        "skuId": 256
    },
    "heartRateLast": 85, // BPM
    "heartRateResting": 65, // BPM
    "heartRateSummary": {
        "maximum": {
            "time": 1708437033, // Unix timestamp
            "time_zone": 0, // GMT+0
            "hr_value": 154 // BPM
        }
    },
    "battery": 99, // Percentage
    "bloodOxygen": {
        "value": 97, // Percentage
        "time": 1708433574, // Unix timestamp
        "retCode": 2 // 2: Success, other: Failed
    },
    "bloodOxygenLastFewHour": [],
    "calorie": 247, // Kcal
    "calorieT": 800, // Kcal
    "distance": 3391, // Meters
    "fatBurning": 39,
    "fatBurningT": 30,
    "paiDay": 2,
    "paiWeek": 155,
    "sleepInfo": {
        "score": 93,
        "startTime": 1186, // Minutes from 00:00
        "endTime": 1648, // Minutes from 00:00
        "deepTime": 103, // Minutes
        "totalTime": 463 // Minutes
    },
    "sleepStgList": {
        "WAKE_STAGE": 7,
        "REM_STAGE": 8,
        "LIGHT_STAGE": 4,
        "DEEP_STAGE": 5
    },
    "SleepingStatus": 0, // 0: Awake, 1: Sleeping
    "stands": 5, // Times
    "standsT": 12, // Times
    "steps": 4461, // Steps
    "stepsT": 6000, // Steps
    "stress": {
        "value": 49,
        "time": 1708439460
    },
    "isWearing": 1 // 0: not wearing, 1: wearing, 2: in motion, 3: not sure
}
Now you can save the JSON or teleport it to other monitoring systems like Prometheus or Grafana.
You can scrap the data with Prometheus.
First, you need to create a new Prometheus server. You can start it with Docker:
sudo docker run -d --name prometheus -p 9090:9090 -v /var/www/prometheus:/etc/prometheus prom/prometheusThen, edit the prometheus.yml file:
global:
  scrape_interval: 300s

scrape_configs:
  - job_name: health
    scheme: https
    static_configs:
      - targets: [health.aiursoft.cn]
    metrics_path: /api/metrics/metric
    params:
      nick-name: ['AnduinXiaomi'] # Replace with your own user name
    scrape_interval: 300s
    honor_labels: true
Here I'm using the health.aiursoft.cn server, and I want to scrap the data of the user AnduinXiaomi as an example. You need to replace the server and user name with your own.
Then, restart the Prometheus server:
sudo docker restart prometheusNow open the Prometheus server at http://localhost:9090, and you can see the metrics data.
You can visualize the data with Grafana.
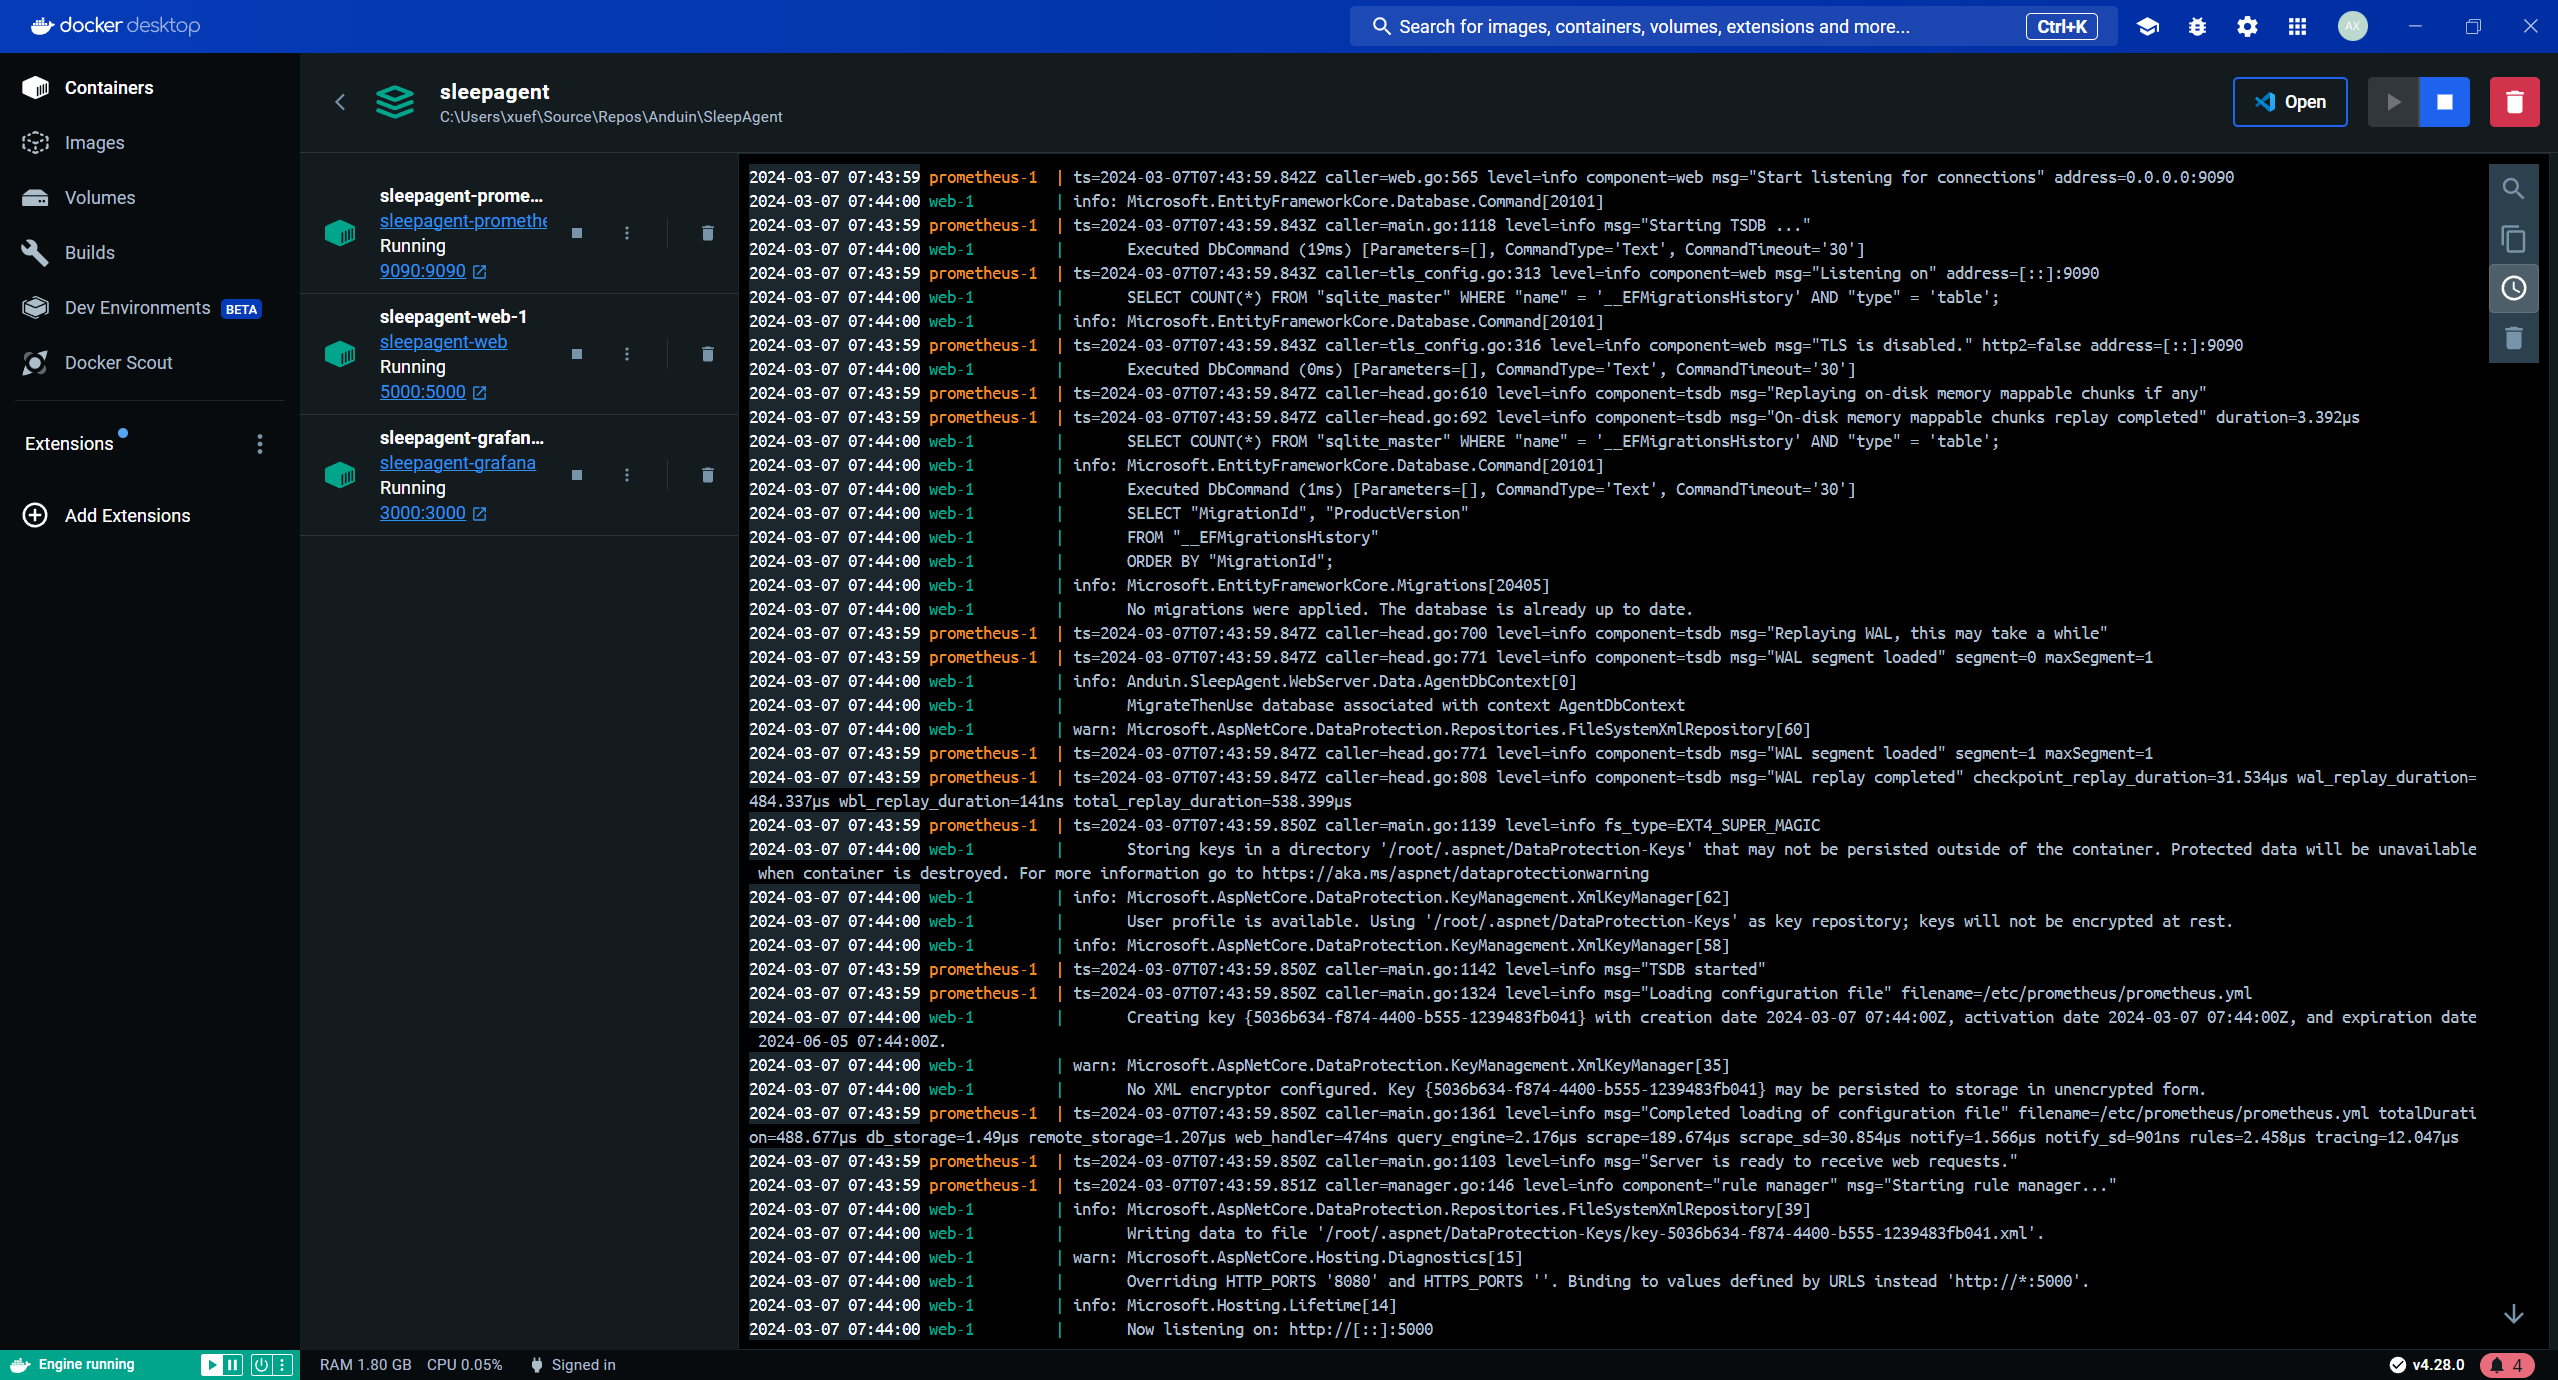
First, you need to create a new Grafana server. You can start it with Docker-compose.
sudo docker-compose up -dThis command will start 3 docker containers:
- SleepAgent: The server that stores the sleep data.
http://localhost:5000 - Prometheus: The server that scraps the sleep data.
http://localhost:9090 - Grafana: The server that visualizes the sleep data.
http://localhost:3000
Edit your clock app's settings, and change the endpoint to http://YOUR_BOX:5000/api/metrics/send.
Then, open the Grafana server at http://localhost:3000, login with account: admin, password: admin.
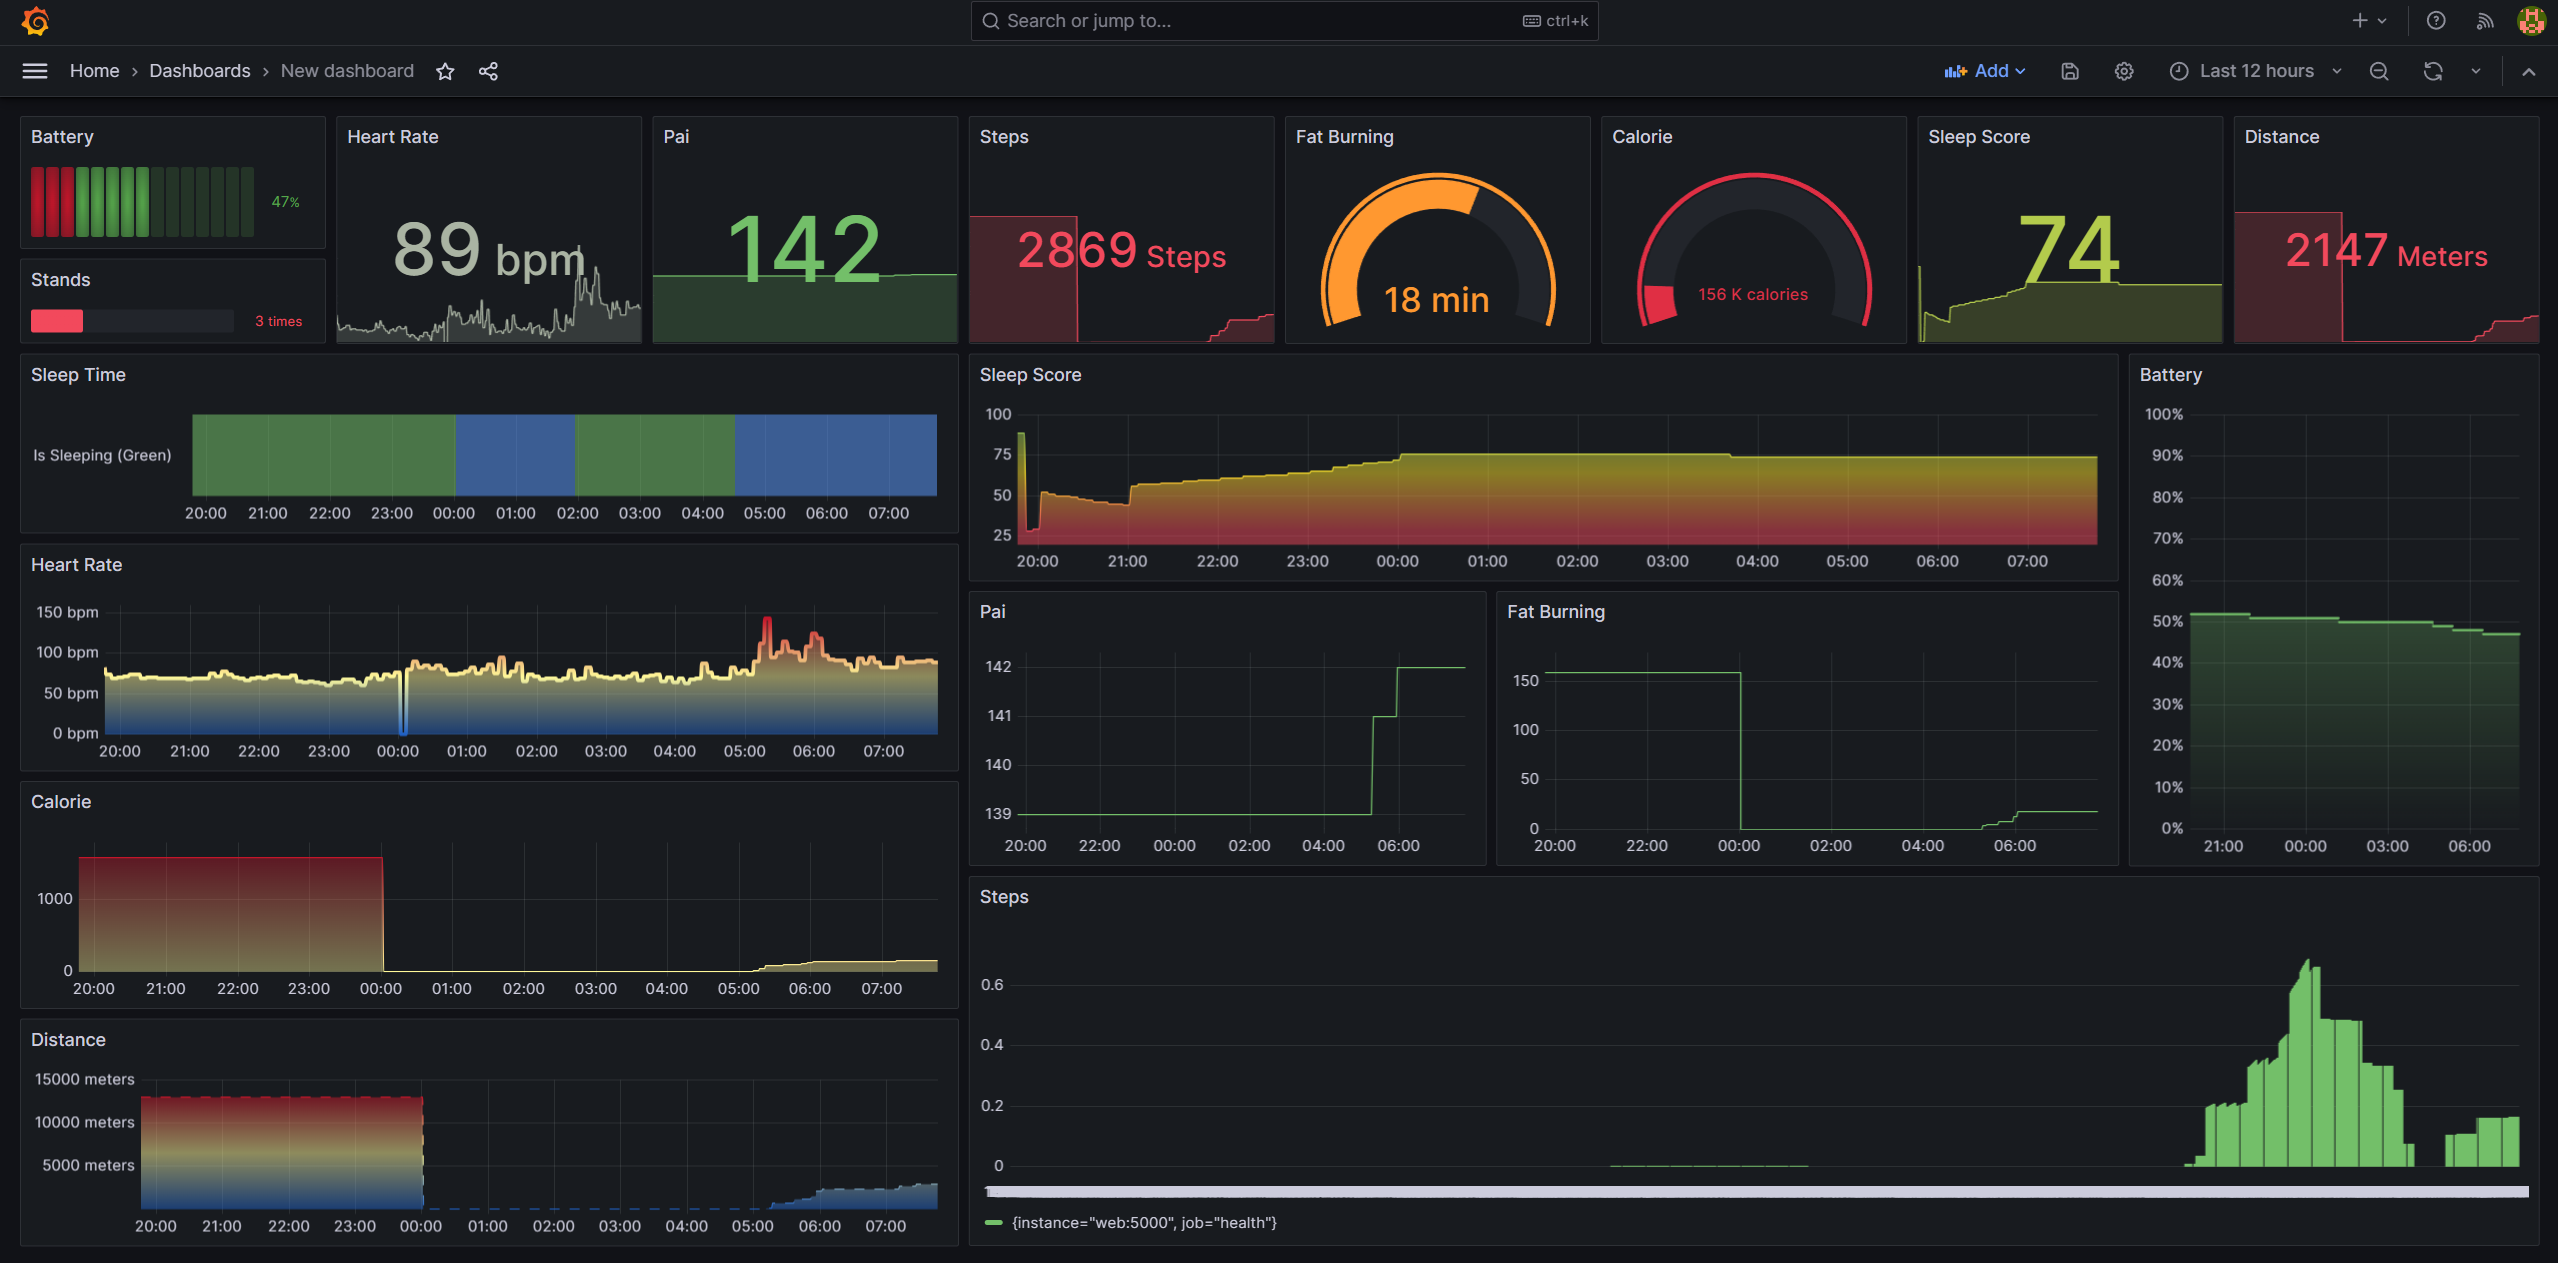
You will see the dashboard.
There are many ways to contribute to the project: logging bugs, submitting pull requests, reporting issues, and creating suggestions.
Even if you with push rights on the repository, you should create a personal fork and create feature branches there when you need them. This keeps the main repository clean and your workflow cruft out of sight.
We're also interested in your feedback on the future of this project. You can submit a suggestion or feature request through the issue tracker. To make this process more effective, we're asking that these include more information to help define them more clearly.


