Seinfeld Data Analysis
This project displays data visualizations in an attempt to find out what makes an episode of Seinfeld "good". It attempts to find a number of correlations including number of words spoken by each main character, the episode directors, and sentiment of the dialogue to try and understand what makes some episodes more successful than others. Utlimately, there were no strong indications that there were any correlations in the data we analyzed. If the study were to continue, it would be adventageous to look at additional data such as money spent on advertisement, episode airtimes, and number of jokes said per episode or character.
Contributors
Andrew Rottier, acrottier@wpi.edu
Cory Tapply, cmtapply@wpi.edu
Diana Doherty, ddoherty2@wpi.edu
To run this project, following the following steps:
- Run
npm installin theSeinfeld-Data-Analysisfolder. - Run locally with
npm start. - Go to
localhost:8080to see the website.
Season Popularity
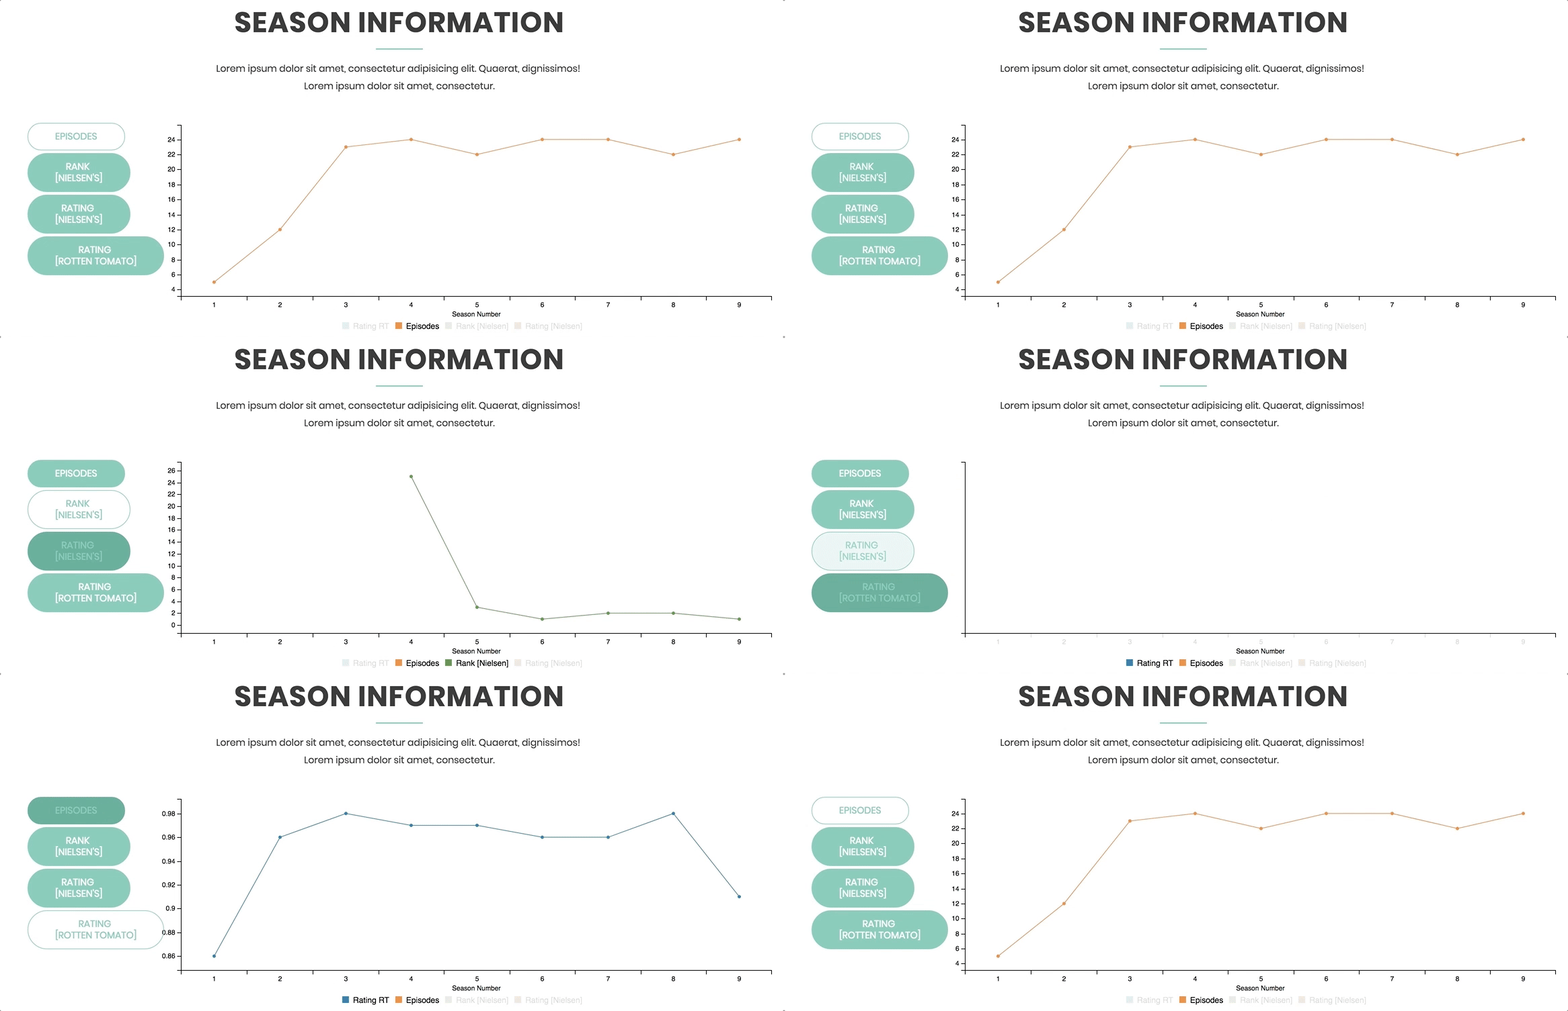
The following graphs display Seinfeld season information including number of episodes, rating, and ranks amongst various critics.
Word Frequencies
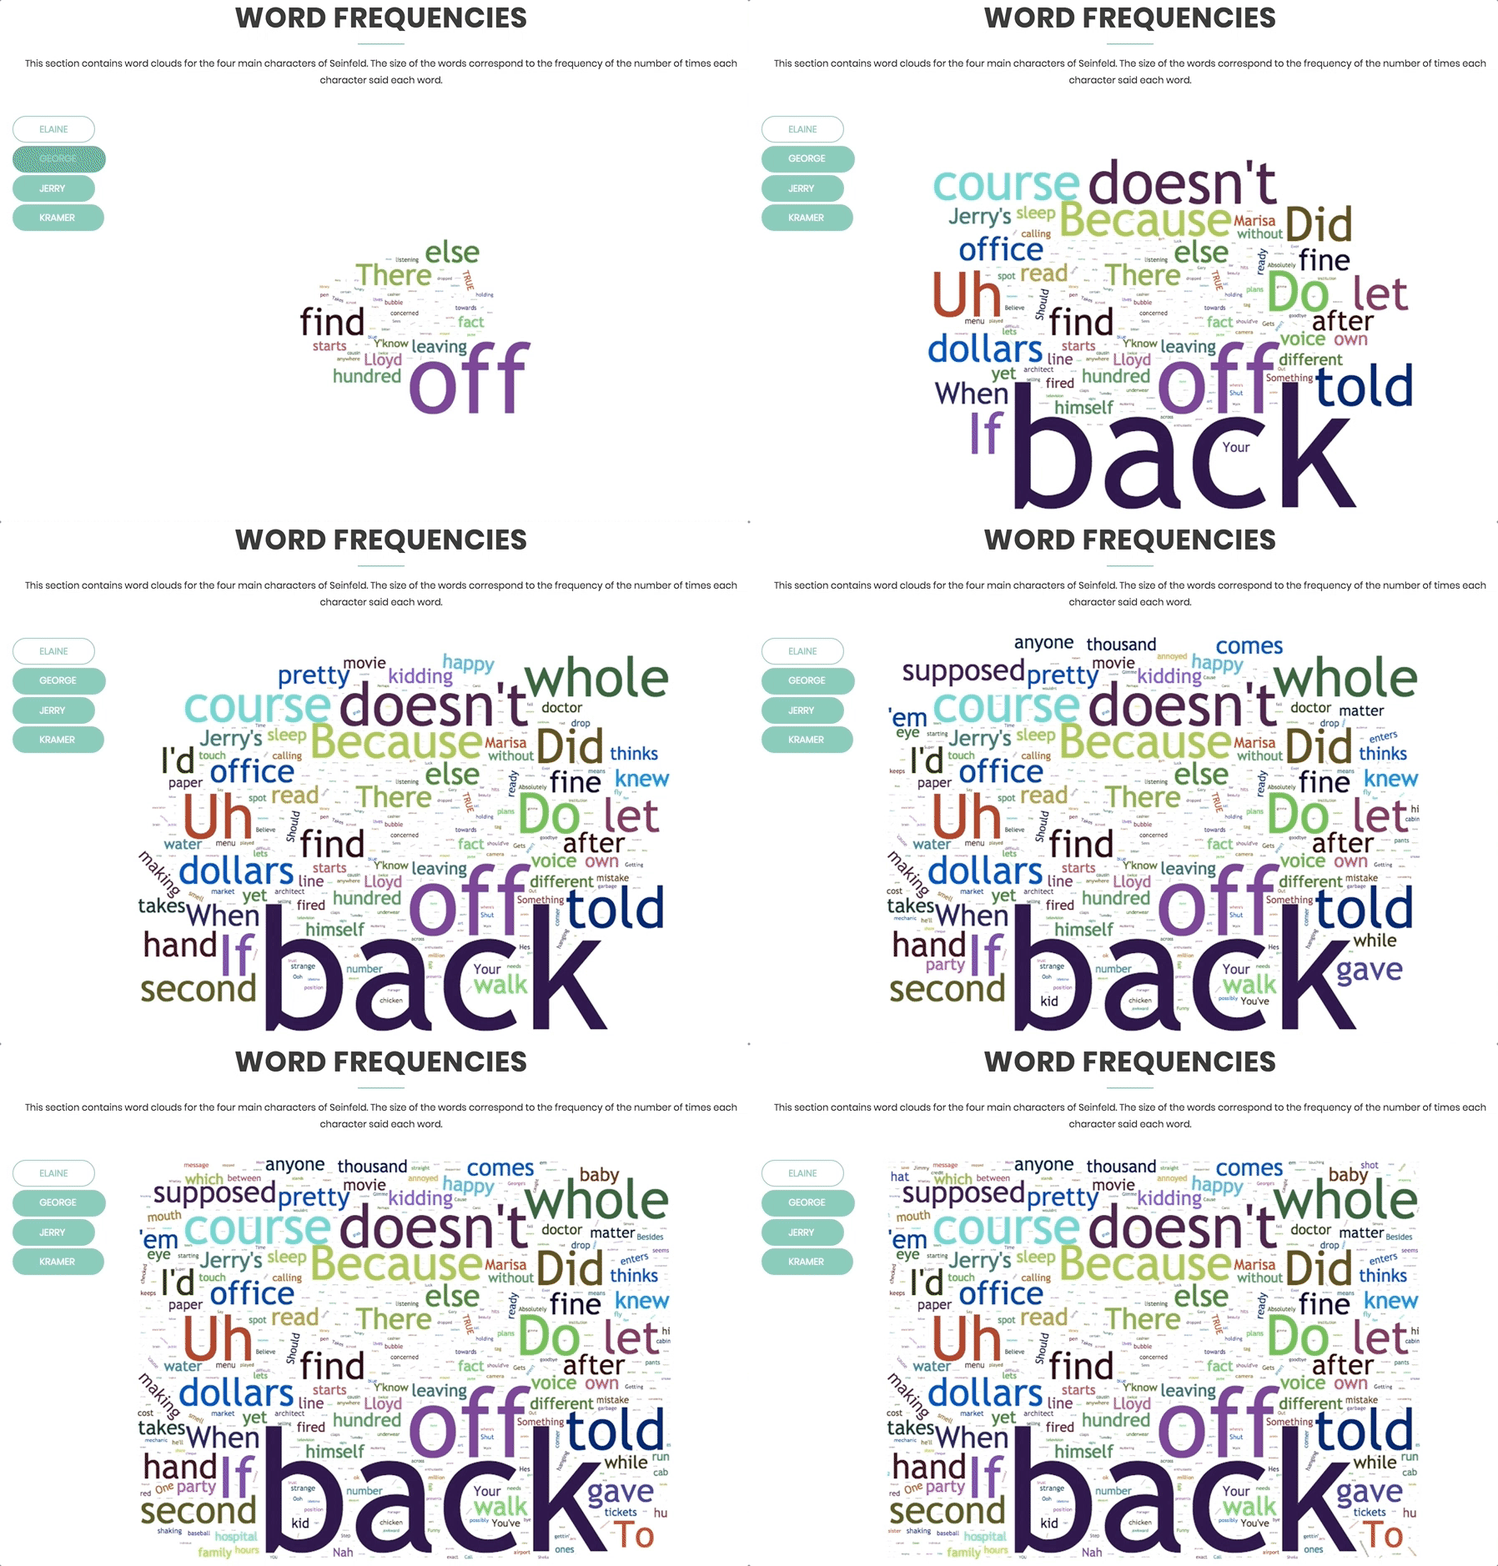
The following section catains a word cloud generated for the main four characters of Seinfeld. Words are proportional to the amount of times each character said each word throughout the show Seinfeld.
Director Popularity
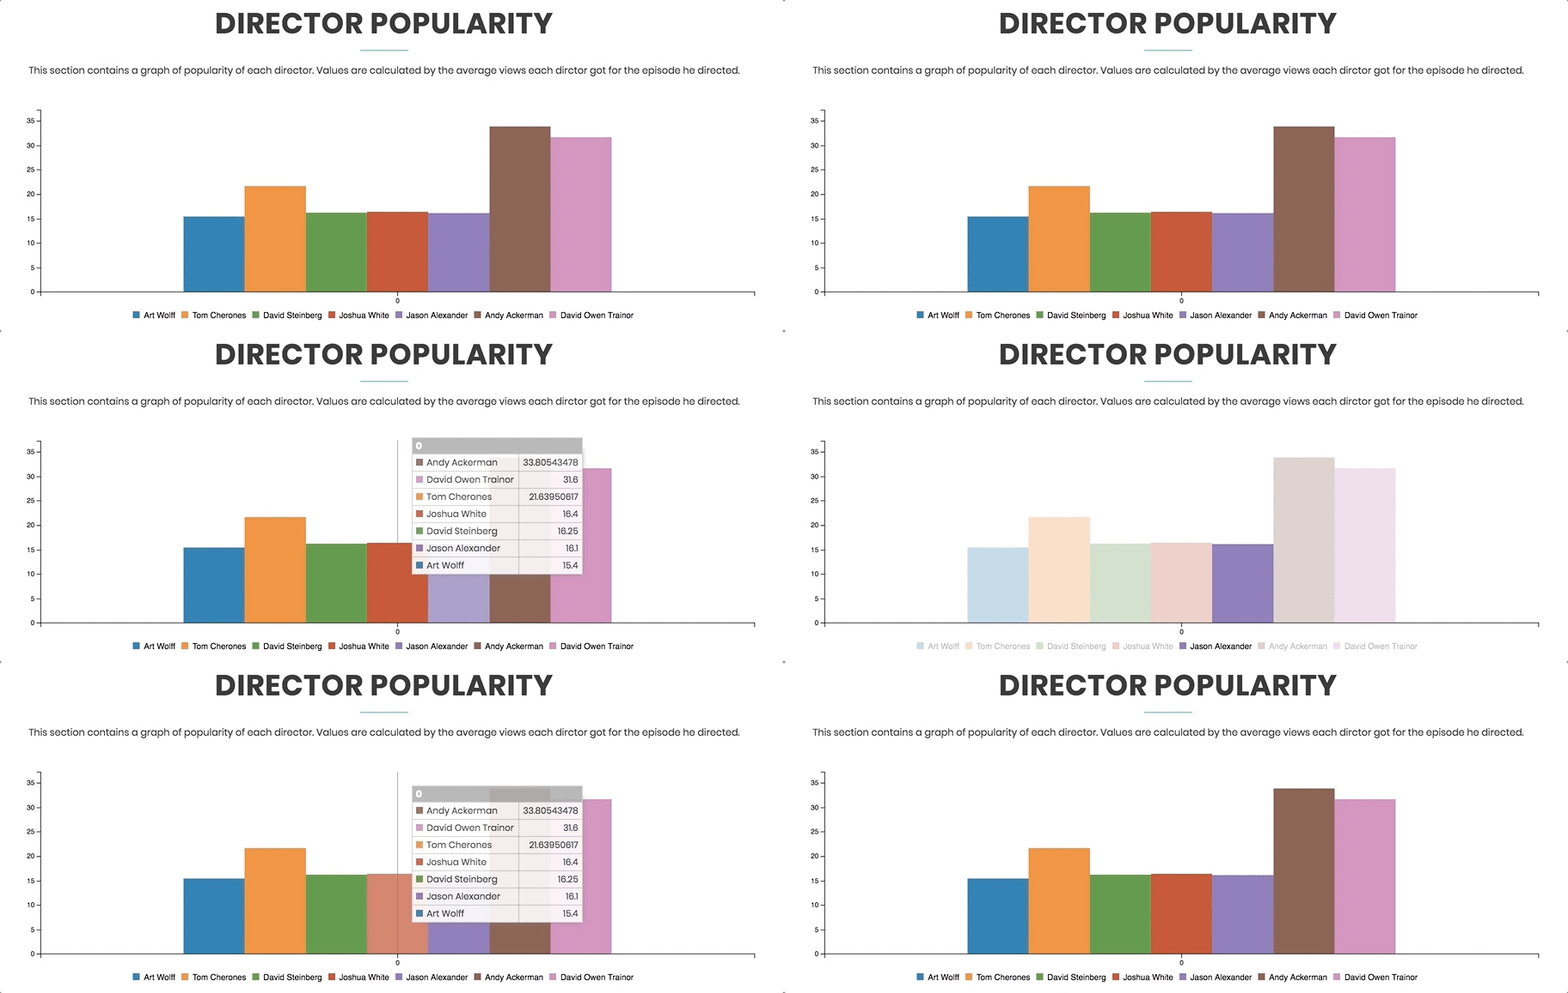
This section contains a graph of popularity of each director. Values are calculated by the average views each dirctor got for the episode he directed.
Episode Popularity
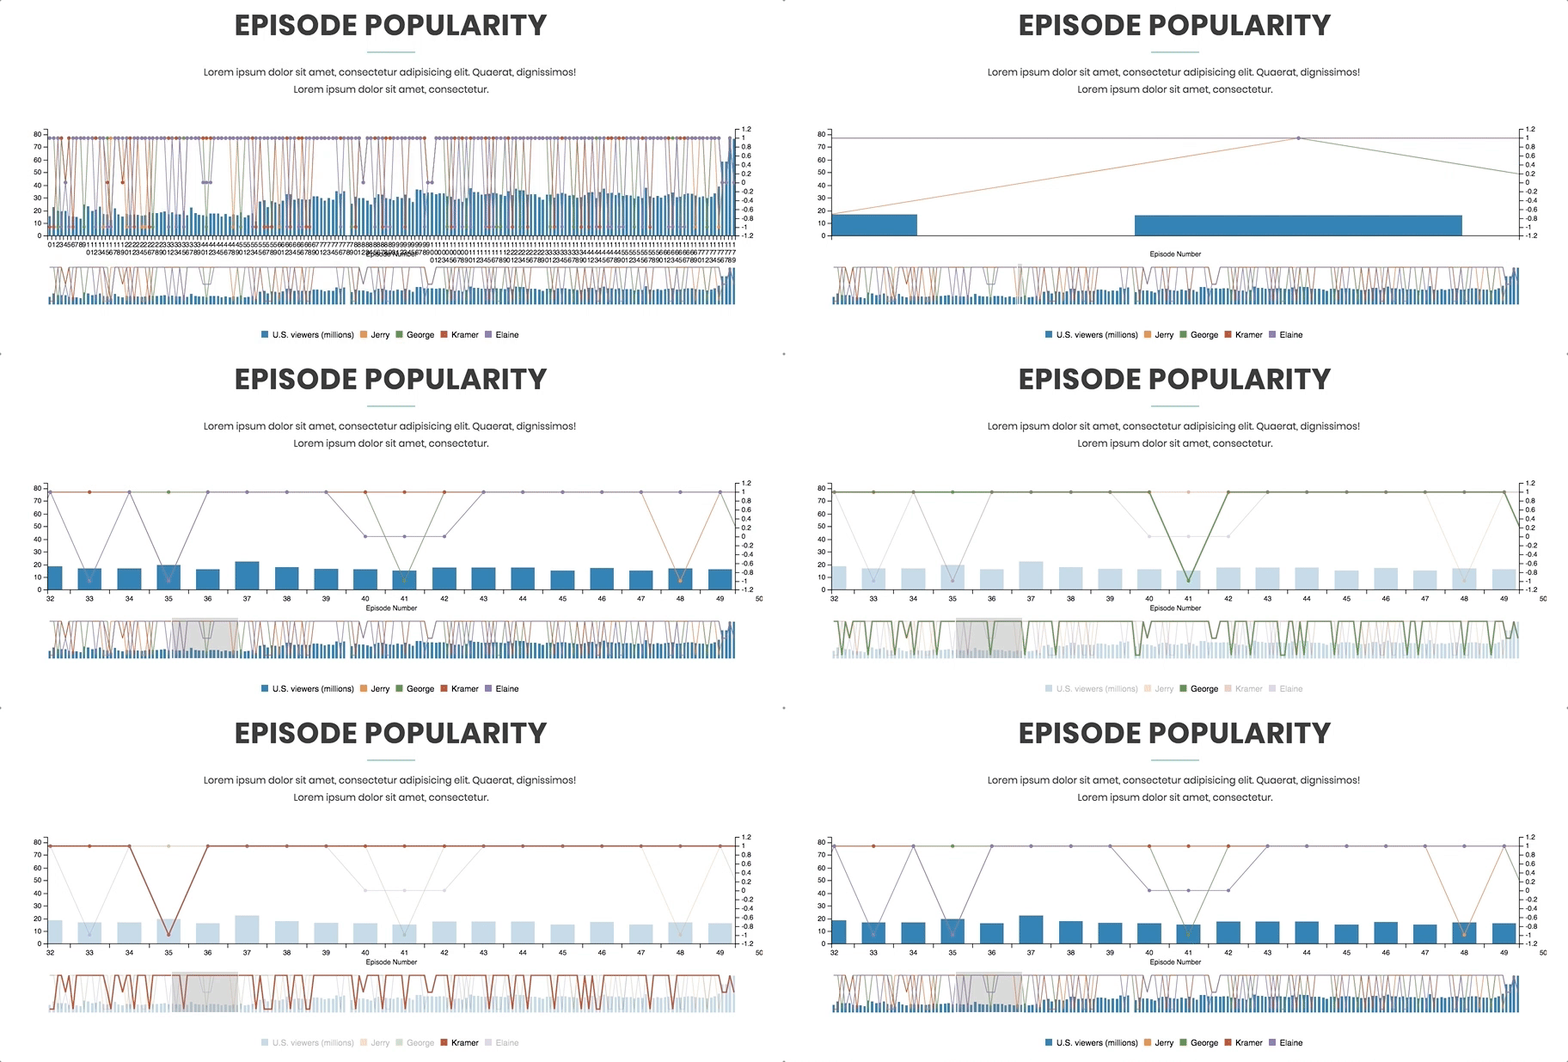
This section contains a graph all of the Seinfeld episodes and plots them against each character's sentiment corresponding to the episode.


