Python script to plot periodic trends as a heat map over the periodic table of elements.
This Python script (periodic_trends.py) can be used to plot a heat map over an image of the periodic table of elements for easy and automated visualization of periodic trends.
A minimal example is as follows:
from periodic_trends import plotter
plotter("ionization_energies.csv")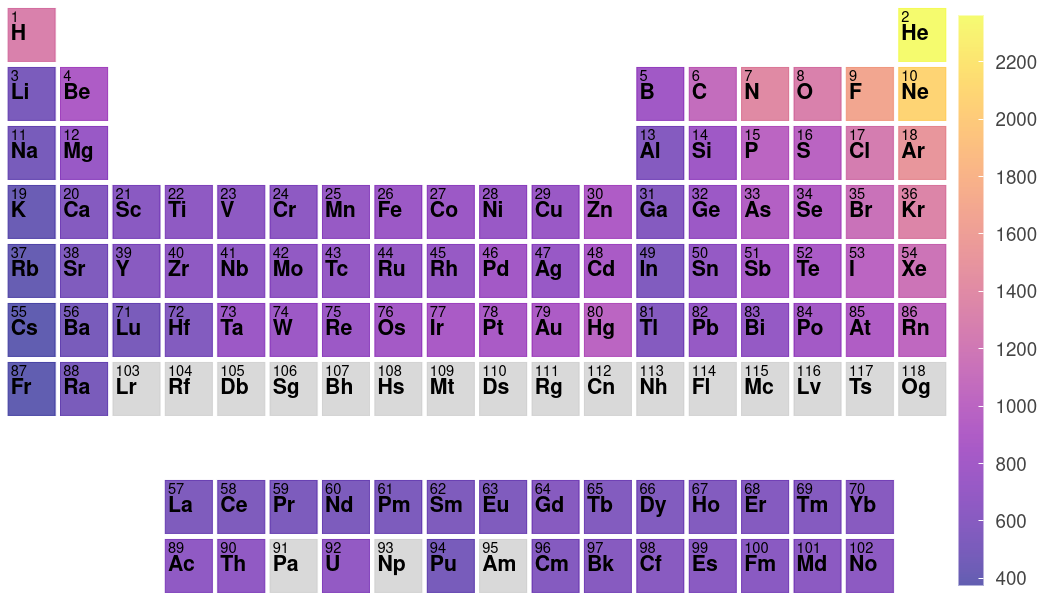
The only required argument to plotter() is a single positional argument for the full filepath/name (with extension) of the data file containing your periodic trend data. The data file must be in a comma-separated value (.csv) format with the first entry in each row being the atom symbol and the second entry being the value you wish to plot. An example .csv file is included in this repository for testing purposes under the name ionization_energies.csv. After the periodic_trends.py script is run, it will show the plot in your web browser. To save the image, simply click the save icon that appears in the web browser figure.
There are numerous optional arguments, which can be used to modify the appearance of the figure. The full argument list is below:
|
def plotter( |
|
filename: str, |
|
show: bool = True, |
|
output_filename: str = None, |
|
width: int = 1050, |
|
cmap: str = "plasma", |
|
alpha: float = 0.65, |
|
extended: bool = True, |
|
periods_remove: List[int] = None, |
|
groups_remove: List[int] = None, |
|
log_scale: bool = False, |
|
cbar_height: float = None, |
|
cbar_standoff: int = 12, |
|
cbar_fontsize: int = 14, |
|
blank_color: str = "#c4c4c4", |
|
under_value: float = None, |
|
under_color: str = "#140F0E", |
|
over_value: float = None, |
|
over_color: str = "#140F0E", |
|
special_elements: List[str] = None, |
|
special_color: str = "#6F3023", |
|
) -> figure: |
|
|
|
""" |
|
Plot a heatmap over the periodic table of elements. |
|
|
|
Parameters |
|
---------- |
|
filename : str |
|
Path to the .csv file containing the data to be plotted. |
|
show : str |
|
If True, the plot will be shown. |
|
output_filename : str |
|
If not None, the plot will be saved to the specified (.html) file. |
|
width : float |
|
Width of the plot. |
|
cmap : str |
|
plasma, inferno, viridis, magma, cividis, turbo |
|
alpha : float |
|
Alpha value (transparency). |
|
extended : bool |
|
If True, the lanthanoids and actinoids will be shown. |
|
periods_remove : List[int] |
|
Period numbers to be removed from the plot. |
|
groups_remove : List[int] |
|
Group numbers to be removed from the plot. |
|
log_scale : bool |
|
If True, the colorbar will be logarithmic. |
|
cbar_height : int |
|
Height of the colorbar. |
|
cbar_standoff : int |
|
Distance between the colorbar and the plot. |
|
cbar_fontsize : int |
|
Fontsize of the colorbar label. |
|
blank_color : str |
|
Hexadecimal color of the elements without data. |
|
under_value : float |
|
Values <= under_value will be colored with under_color. |
|
under_color : str |
|
Hexadecimal color to be used for the lower bound color. |
|
over_value : float |
|
Values >= over_value will be colored with over_color. |
|
under_color : str |
|
Hexadecial color to be used for the upper bound color. |
|
special_elements: List[str] |
|
List of elements to be colored with special_color. |
|
special_color: str |
|
Hexadecimal color to be used for the special elements. |
|
|
|
Returns |
|
------- |
|
figure |
|
Bokeh figure object. |
|
""" |
A couple of examples using various optional keyword arguments are as follows:
from periodic_trends import plotter
plotter("ionization_energies.csv", log_scale=True)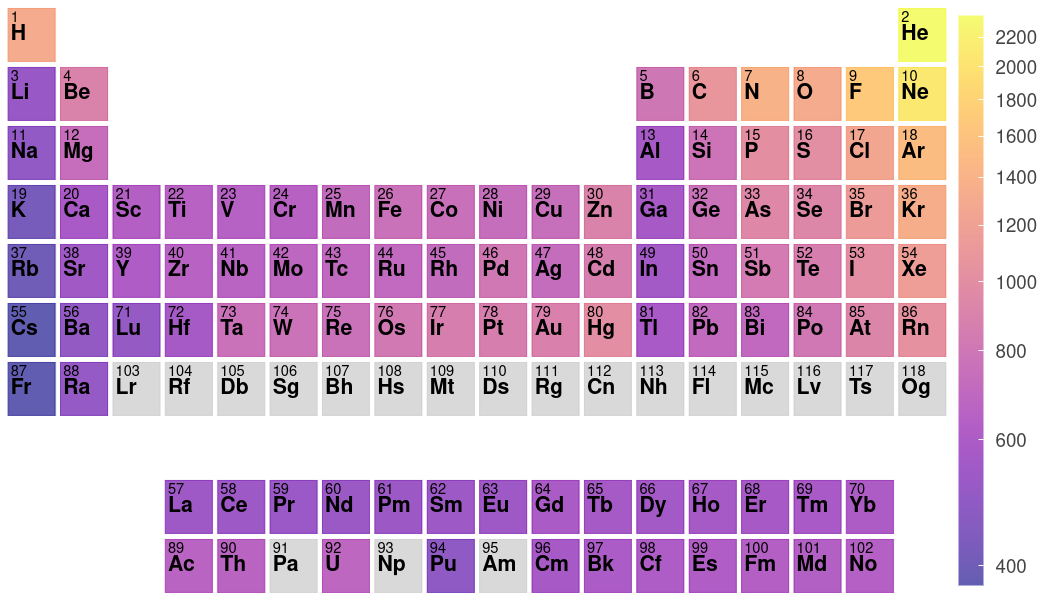
from periodic_trends import plotter
plotter("ionization_energies.csv", cmap="viridis", alpha=0.7, extended=False, periods_remove=[1])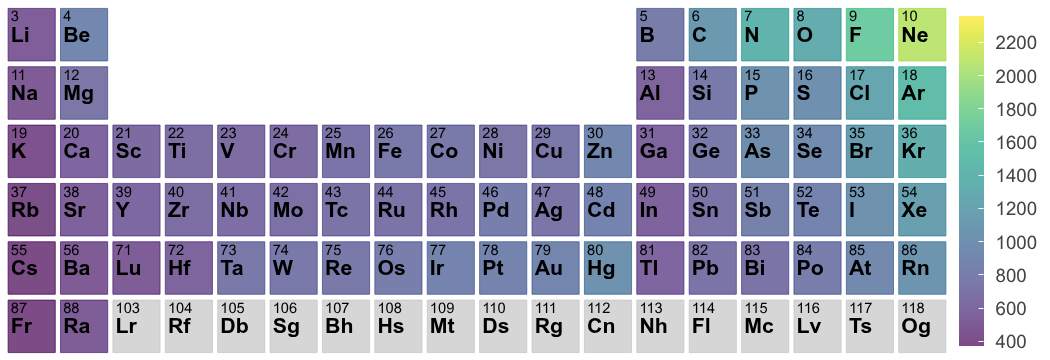
The script requires the following dependencies:
These packages can be installed using pip via pip install -r requirements.txt in the periodic_trends base directory.


